 Dedicated FREE FOREX VPS
 Free FOREX Virtual Private Server
 MT4 Demo Contest, Get $500
 Sign Up for an Account, Claim 60% Deposit Bonus
 Free MT4/MT5 VPS 2024
 Send E-mail and Get Free Merchandise
 $1K Refer a Friend Bonus for Pepperstone Pro clients
 Maximize Your Earnings with 100% Deposit bonus
 Trade to Win, $5,000 Monthly Demo Contest
 Claim 30% + 15% Deposit Bonus from LiteFinance
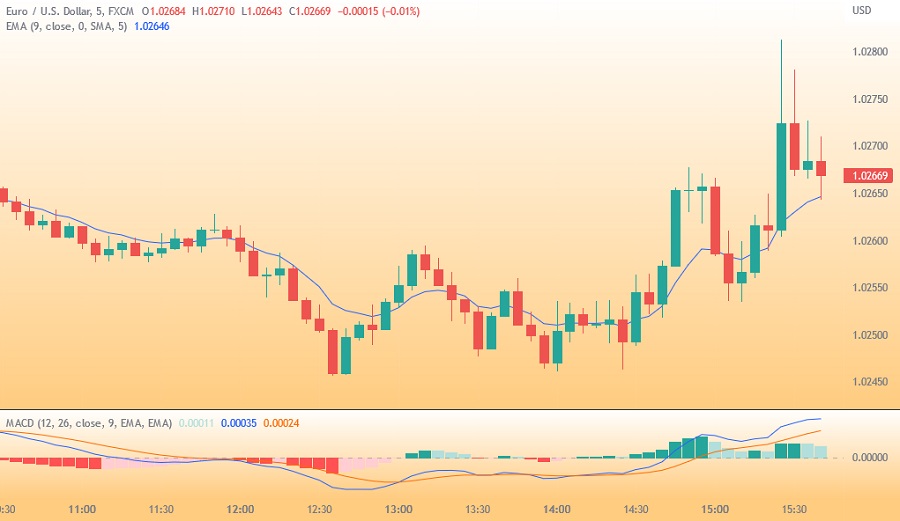
There are a number of reasons why traders prefer to trade with 5-minute charts. But, what are the best indicators to apply on this time frame?

5-minute charts show traders an overview of an asset's activity in the market for every 5 minutes within a specific trading session. The main market session is 6.5 hours per day which means a 5-minute chart will contain 78 five-minute bars for every complete trading session. Day traders tend to trade 5-minute charts as they enable them to pinpoint short-term trends, making it possible to execute their preferred trading strategy.
5-minute charts are also ideal for momentum traders who wait for the market to gain sufficient strength to move the currency in a favorable direction so that they can capitalize on the momentum for an extended move. However, once the move begins to display signs of losing strength, momentum traders will pull out which is why such traders need a strategy with reliable exit rules to protect their profits. This is what the 5-minute chart gives them.
What are the Best Indicators on 5-Minute Charts?
The 5-minute chart enables forex traders to take advantage of reversals in the market while staying in position as prices start to move in a new direction. However, to achieve optimum results with the 5-minute chart, it requires two major indicators which are the Exponential Moving Average (EMA) and an oscillator indicator. Both of them are technical indicators and have separate functions. EMA helps to determine the trend with emphasis placed on recent movements, while the oscillator is used to measure momentum.
How the Strategy Works
The oscillator used in this example would be MACD. To use the 5-minute chart with the EMA and MACD, the idea is to wait for a reversal trade and then capitalize on the setup once the momentum provides sufficient support to the reversal such that it can create a bigger extension burst.
Exiting the position is carried out in two parts; the first part is to help the trader lock in profits and ensure that a winning trade does not turn into a losing one. The second part allows the trader to try and capture what could be a huge move without any risk since the stop has been moved already to breakeven. Let us now examine how to use the 5-minute chart together with the indicators as a trading strategy.
For a long trading position, these are the rules for using 5-minute chart with EMA and MACD:
- Identify a currency pair that is trading below the 20 EMA and MACD to get into negative territory.
- Wait for the price to move up beyond the 20 EMA and then ensure that the MACD is either about to move from negative to positive or is already in the positive territory within the last 25 minutes (five bars or less on the 5-minute chart).
- Take a long position 10 pips above the 20 EMA.
- To execute an aggressive trade, position a stop at the swing low on the 5-minute chart. However, for a conservative trade, the stop should be positioned 20 pips below the 20 EMA.
- Half of the position should be sold at entry along with the risked amount; then move the stop on the second half to breakeven.
- Trail the stop by breakeven or the 20 EMA minus 15 pips, depending on which one is higher.
For a short trading position, here are the rules:
- Identify a currency pair that is trading above the 20 EMA and MACD to get into positive territory.
- Wait for the price to move below the 20 EMA and then ensure that the MACD is either about to move from positive to negative or is already in negative territory within the last 25 minutes.
- Take a short position 10 pips below the 20 EMA.
- To execute an aggressive trade, position a stop at the swing high on the 5-minute chart. However, for a conservative trade, the stop should be positioned 20 pips above the 20 EMA.
- Half of the position should be bought back at the entry price minus the risked amount; then move the stop on the second half to breakeven.
- Trail the stop by the breakeven or the 20-period EMA minus 15 pips, depending on which one is lower.
Case Study
I'll provide two examples in the EUR/USD currency pair to apply the strategy. Let's examine them.
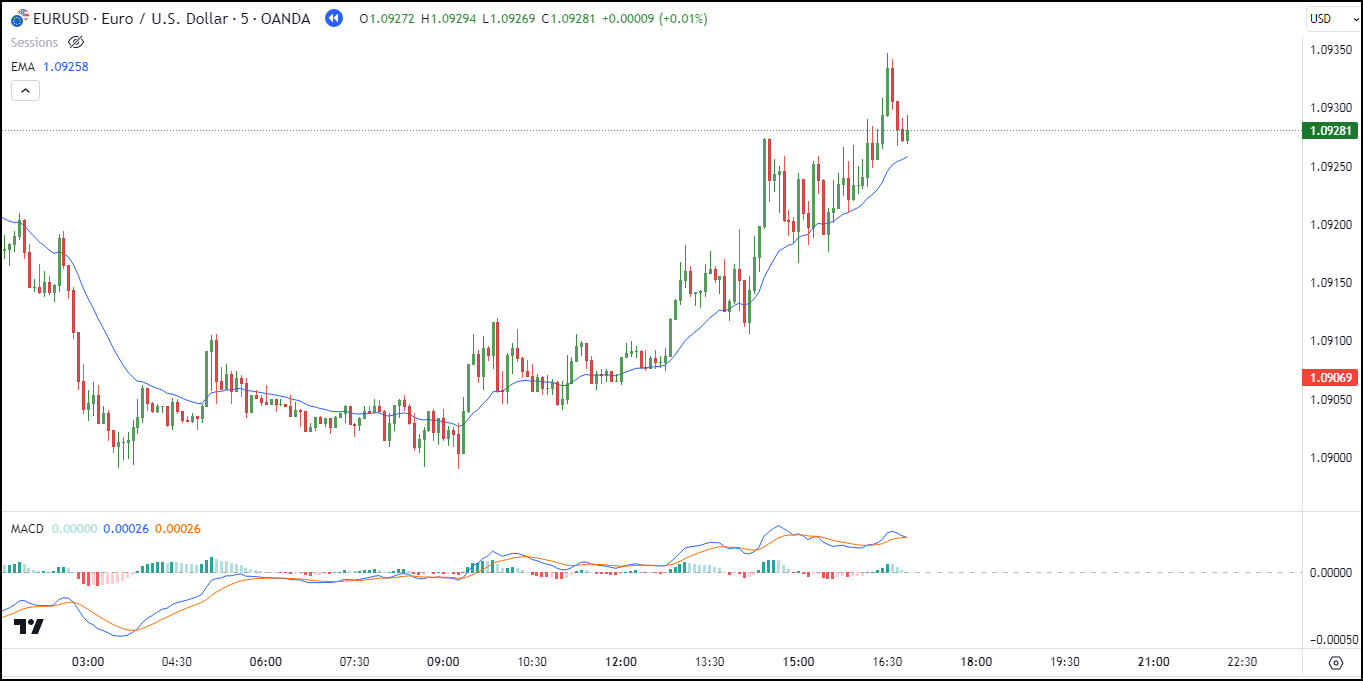
#1 Sell EURUSD
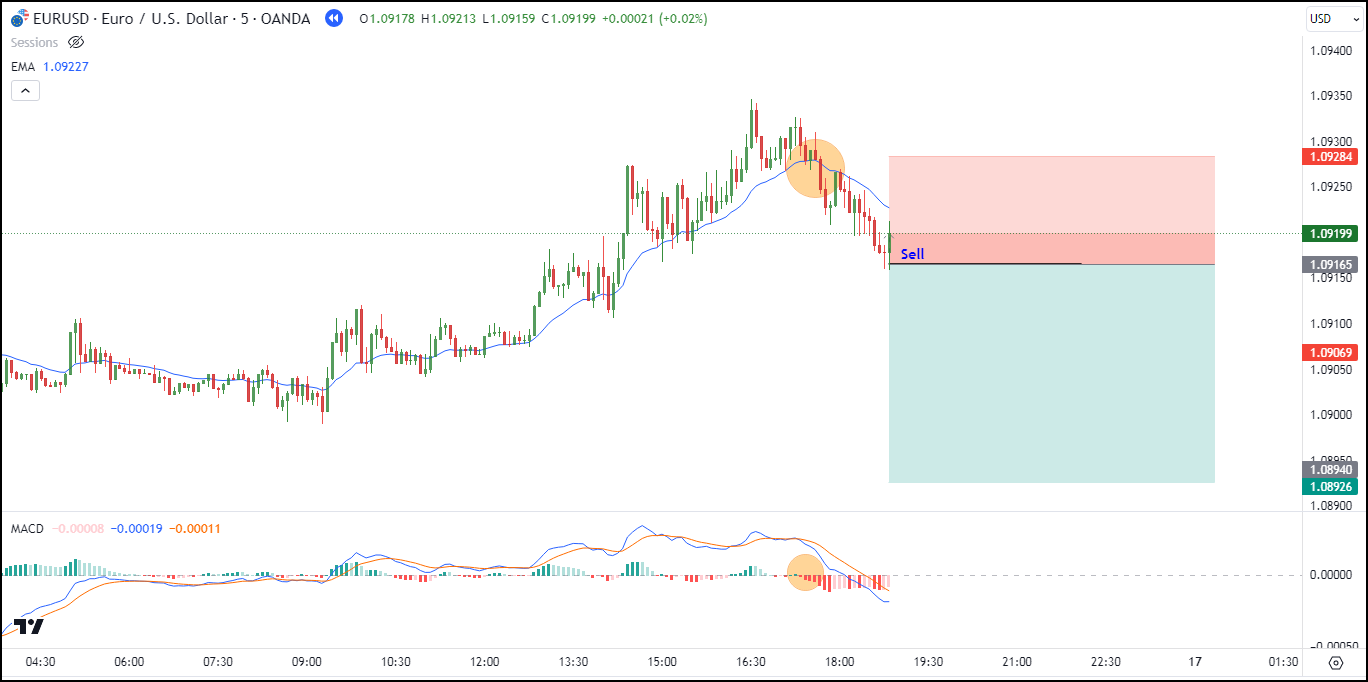
Take a look at the chart below; you can see the price positioned above the 20 EMA line, and the MACD is showing a positive signal (green).
Later on, the price starts to break below the 20 EMA line, and the MACD turns negative. This indicates a potential sell position.
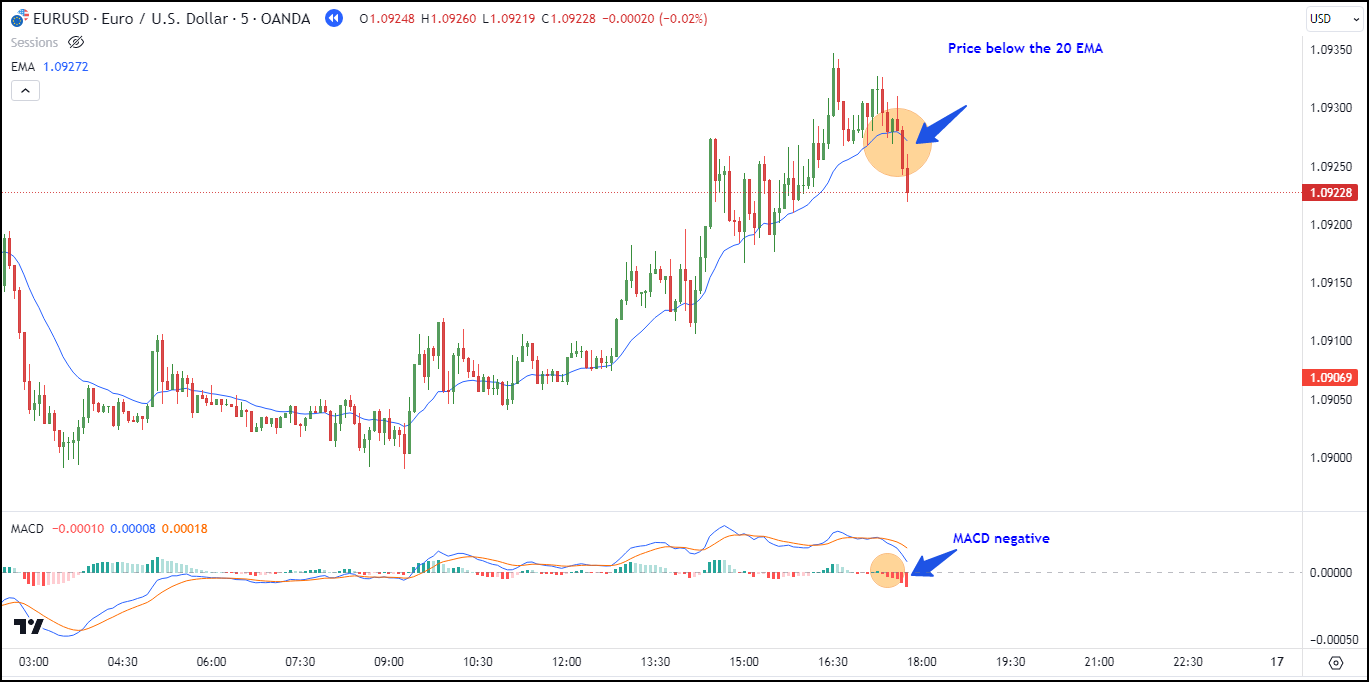
The sell position is initiated approximately 10 pips below the 20 EMA line, specifically at 1.09165.
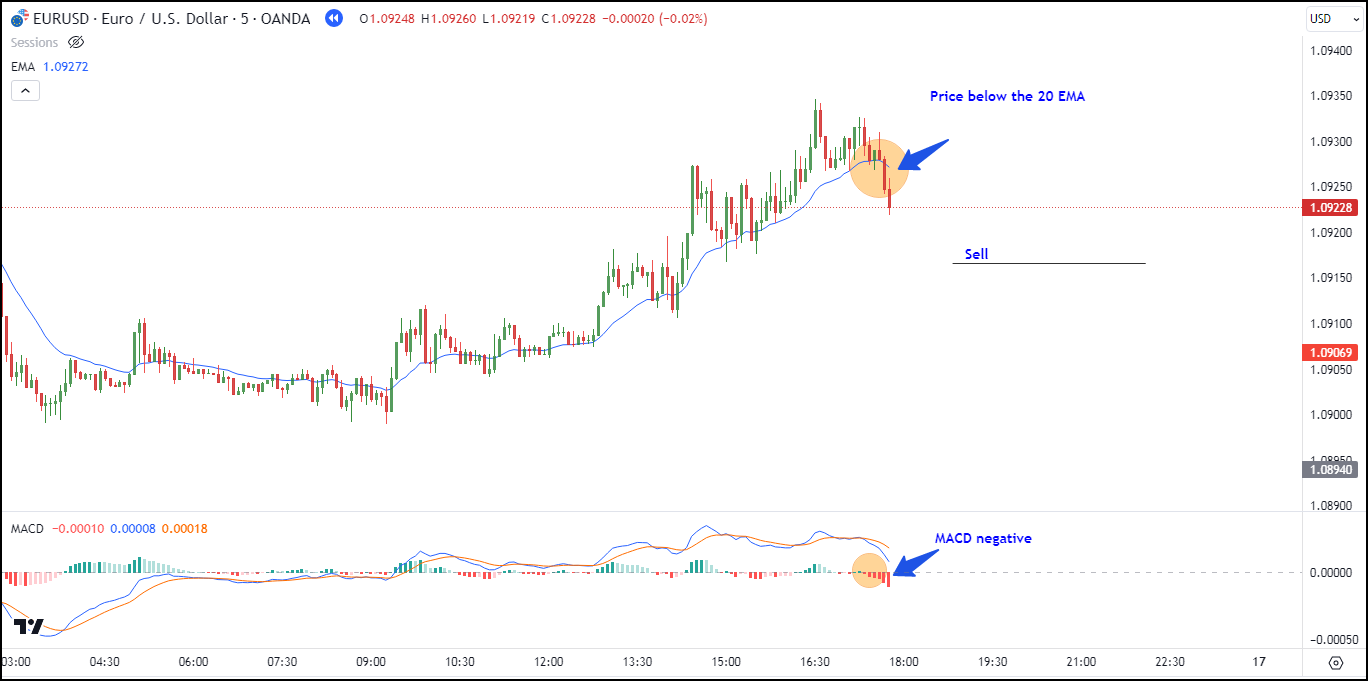
After entering the sell position, place a stop loss (SL) just above the previous swing high (1.09284), and set the take profit (TP) at a distance twice that of the stop loss (1.08926).
The position has reached a 1:1 risk-reward ratio; close half of the position and move the stop loss to breakeven.
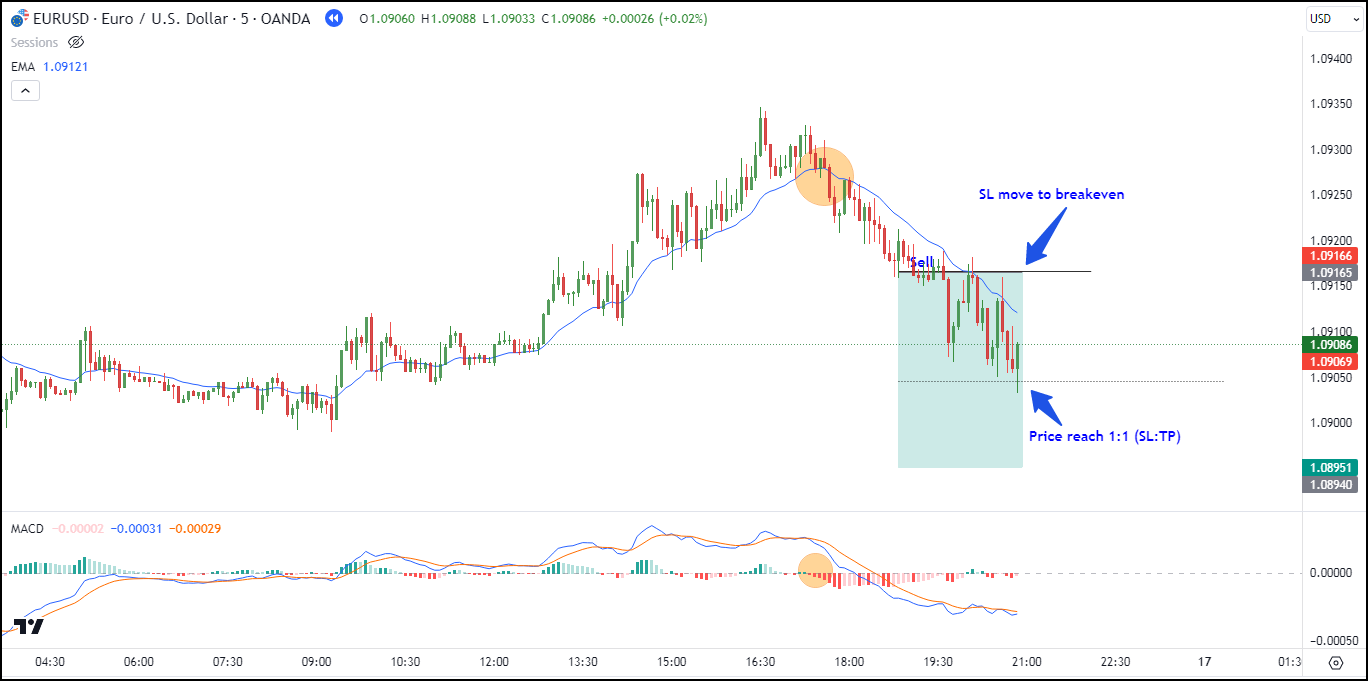
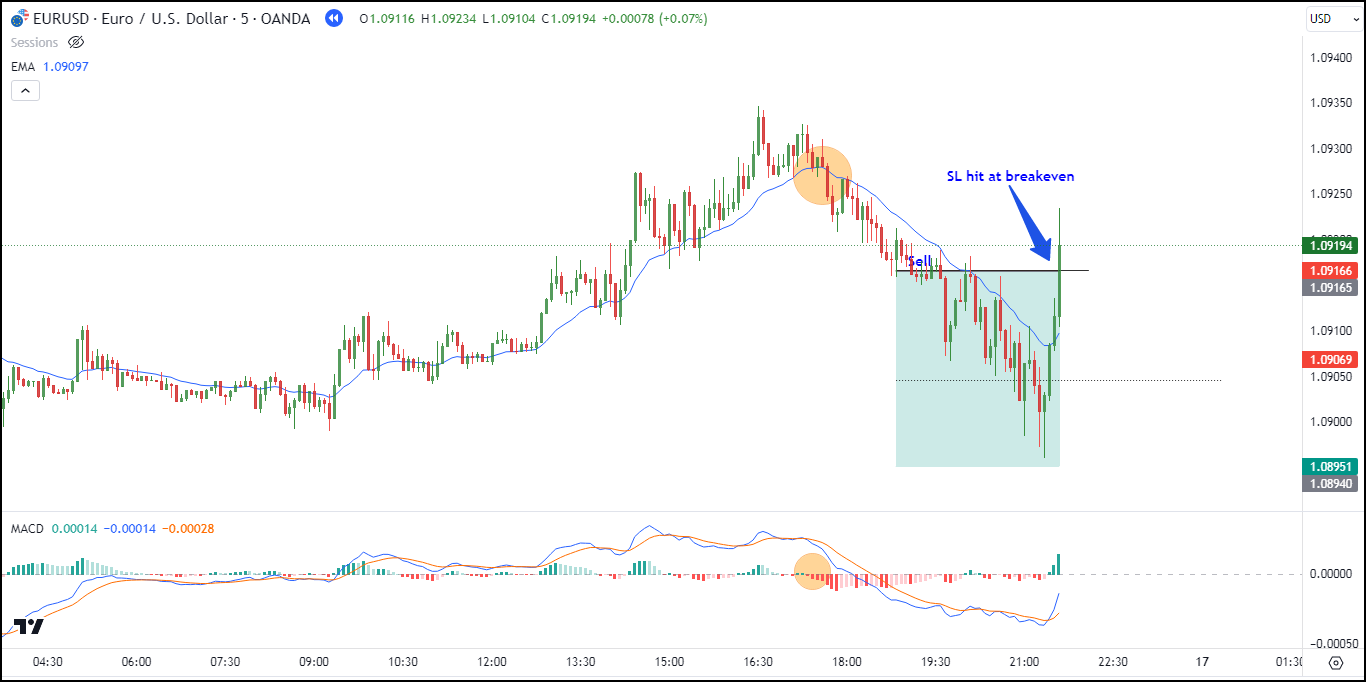
Though the price experienced a temporary decline, it eventually rose again, triggering the stop loss. Half of the position is closed at breakeven, resulting in a total profit equal to half the distance of the stop loss (0.5R).
#2 Sell EURUSD - Loss
In the chart below, the price is already situated below the 20 EMA line, and the MACD has entered negative territory. Consequently, we enter a sell position 10 pips away from the 20 EMA line.
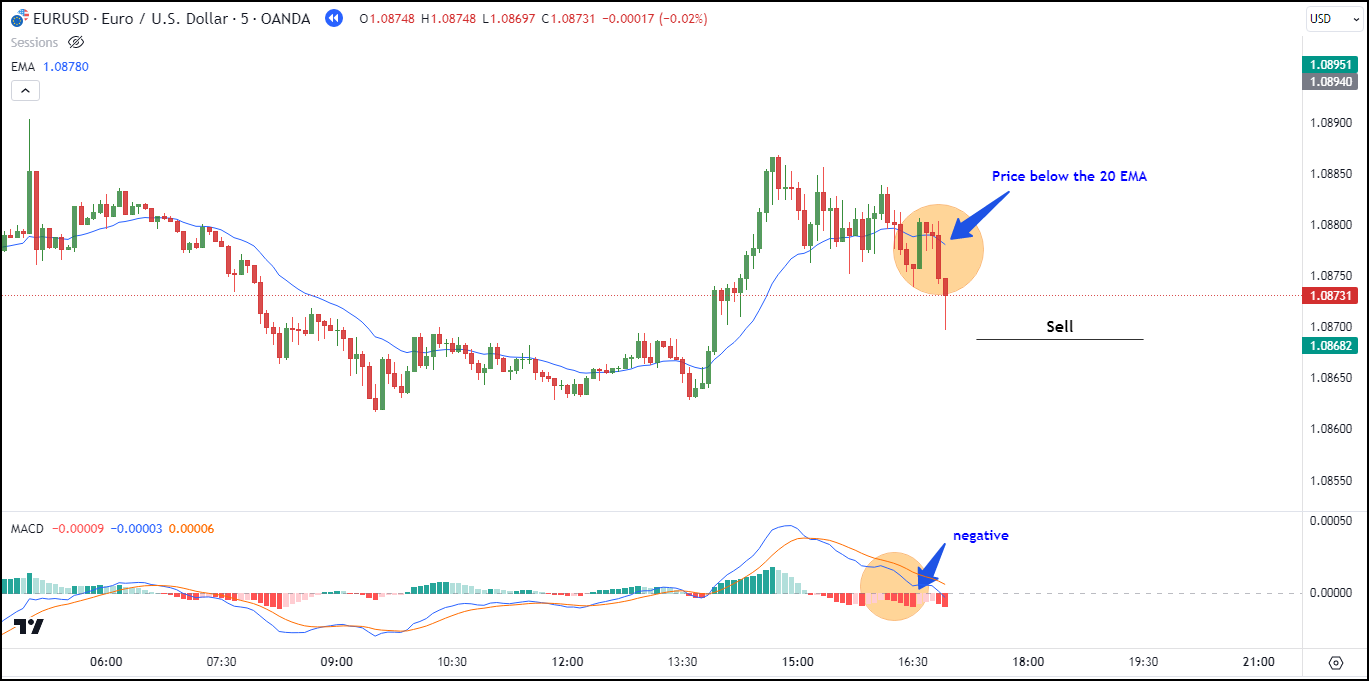
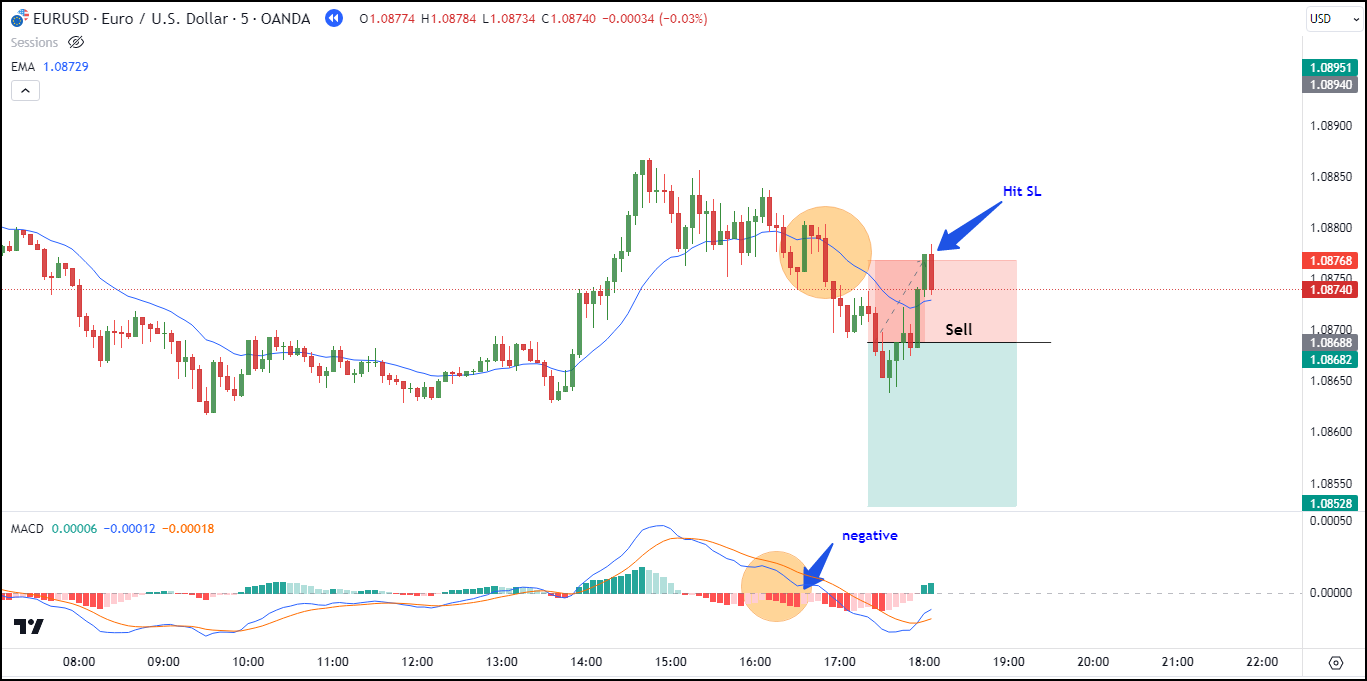
The price continues to decline until it reaches the entry price of 1.08682. Place the stop loss above the previous swing high (1.08768), and set the take profit at a distance twice that of the stop loss (1.08528).
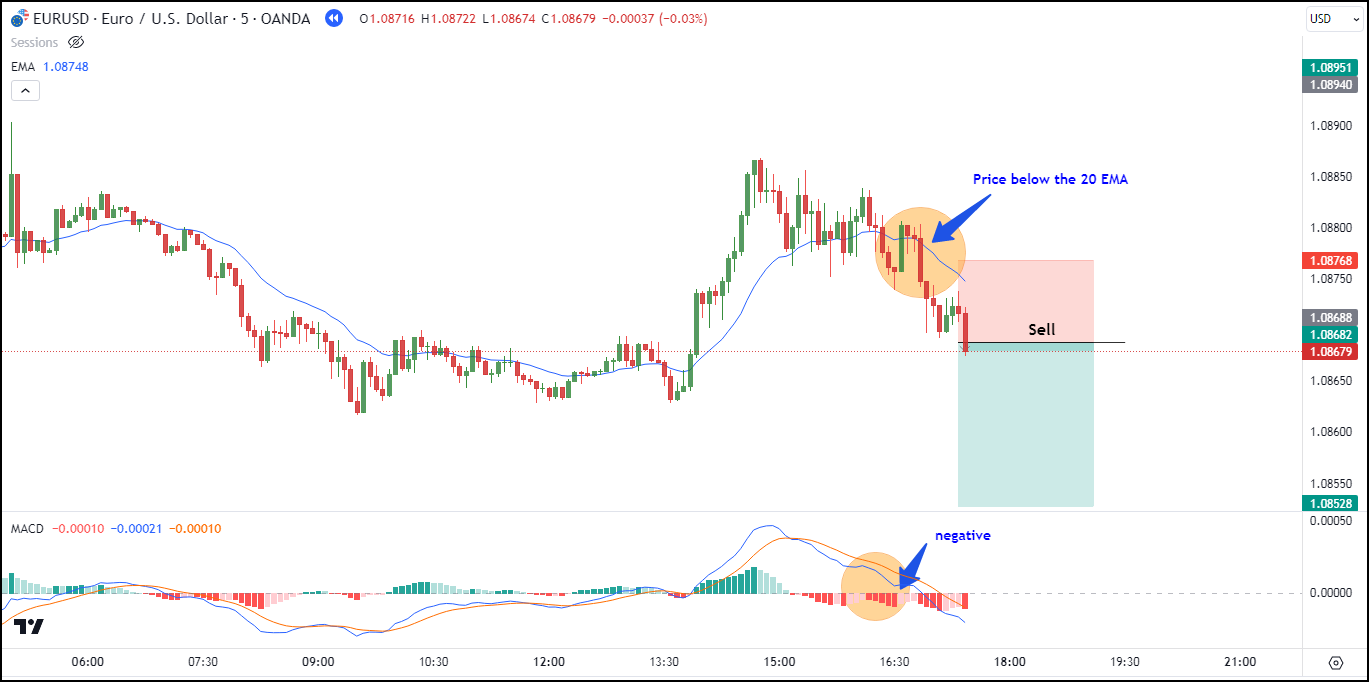
After entering the sell position, the price unexpectedly rises, triggering the stop loss. The position concludes with a loss.
Are EMA and MACD Really the Best Indicators for a 5-Minute Time Frame?
To test whether EMA and MACD are the best indicators for a 5-minute time frame, we will compare them with other indicators. The comparative indicators used are EMA + Stochastic and EMA + RSI.
The stochastic and RSI indicators use standard settings, namely a period of (14,3,3) for Stochastic and a period of 14 for RSI. Both comparative methods use different implementations compared to EMA + MACD, specifically signal divergence on stochastic and RSI. Divergence on stochastic and RSI indicates weakening price momentum and a significant possibility of a reversal.
In EMA + Stochastic, a valid entry occurs if there is stochastic divergence in the same direction as the EMA line. On the other hand, in EMA + RSI, a valid entry occurs when there is divergence in the same direction as the EMA line.
Additionally, just like the approach above, the risk/reward ratio used is 1:2. However, after entry and when the price reaches a 1:1 RR ratio, half (50%) of the position is closed, and the stop loss is adjusted to the entry price (breakeven). The remaining position is then left to either reach the take profit or potentially hit the stop loss.
The testing uses data over 4 months taken from January 2023 to February 2022 and April 2023 to May 2023. Entry positions are only taken during 2 sessions: London (Europe) and New York (United States).
Here is a summary of the testing:
Indikator | EMA + MACD | EMA + Stochastic | EMA + RSI |
Total Trades | 222 | 144 | 138 |
Profit | 84 | 62 | 55 |
Loss | 72 | 42 | 51 |
BEP | 66 | 40 | 32 |
Win rate | 54% | 58% | 52% |
Average Profit | 1.05R | 1.05R | 1.05R |
Average Loss | 1R | 1R | 1R |
Expectancy Value | 0.107 | 0.189 | 0.066 |
From the test results, it's evident that the EMA+MACD combination has the highest frequency with a total of 222 trades, followed by EMA + Stochastic and EMA + RSI with trade frequencies of 144 and 138 respectively.
Combining EMA+MACD proves to earn a good win rate at 54%. However, you might try combining EMA with other oscillators like Stochastic and RSI if you aim for a higher win rate.
Conclusion
In conclusion, the EMA+MACD strategy is a profitable approach but isn't the best indicator for the 5-minute time frame. This is evident from its lower expectancy value compared to the expectancy-value of the EMA+stochastic strategy.
One of the reasons behind this lies in the EMA+MACD's struggle during sideways markets, leading to potentially larger losses. To enhance the accuracy of the EMA+MACD strategy, concentrate on pairs that are currently trending in the H1 time frame.
For more variations on EMA uses on a 5-minute chart, you can refer to "5 Minute Trading Strategy with EMA".


6 Comments
Michael
Nov 30 2023
Hello, I have a few questions. The article discusses a comparison of indicators, specifically EMA + Stochastic and EMA + RSI. As a beginner, I've noticed that terms like Stochastic and RSI appear to be similar, both indicating overbought and oversold conditions, which I understand. The article suggests that using EMA and these indicators isn't too challenging. However, I'm curious about the differences between Stochastic and RSI. Could you please elaborate? Thanks.
Jessie
Dec 2 2023
Hey there! Stochastic and RSI (Relative Strength Index) are both technical indicators commonly used in trading to identify overbought and oversold conditions in the market. You can learn more about those terms in articles : How to Use Stochastic in Forex Trading and Intro to Relative Strength Index (RSI) for Trading
Now about the differences between Stochastic and RSI:
In summary, while both Stochastic and RSI serve similar purposes in identifying overbought and oversold conditions, their calculation methods, scales, and sensitivity to price changes differ. Traders often choose between them based on their specific preferences and trading strategies. Hope it can help you!
Hendra
Dec 2 2023
Hey, just diving into this trading scene! So, I've been on the hunt for indicators and strategies to up my trading game, and I came across this article suggesting the best indicators for a 5-minute hustle. It's all about EMA taking the lead, with MACD, RSI, and Stochastic playing the support role. Now, the article spilled the beans on the win rates, showing an average of 50% across 222 trades. I'm wondering, is a 50% success rate considered good enough for this strategy and these indicators? Like, is that the sweet spot for making it work in the trading world?
Jeremy
Dec 6 2023
@Hendra, Absolutely! A 50% win rate is pretty common in trading, and it's not necessarily a bad thing. What matters is the overall risk-reward ratio and how well it aligns with your trading goals and risk tolerance. A strategy with a 50% win rate can still be profitable if your winning trades are substantially larger than your losing ones. It's crucial to consider the entire picture, including factors like risk management, consistency, and personal comfort with the strategy. So, while 50% might not sound super impressive on its own, it's the bigger context that determines whether the strategy and indicators are working effectively for your specific trading style and objectives.
Forlan
Jan 14 2024
Hey, just putting in some time to work on this theory from the article, and the indicator that stands out for the 5-minute game looks pretty slick. Going through the three theories, each seems to bring its own pros and cons, but I've hit a snag with EMA + MACD, especially when it comes to scalping.
I'm keen on diving deeper into EMA and MACD because, to me, they're like close cousins. But, honestly, on the screen, they seem pretty alike. I'm curious about the exact differences between EMA and MACD. They're giving off good vibes, and visually, they're rocking a similar vibe. Hoping there's some solid intel to clear up the confusion!
Richard
Jan 17 2024
Sure thing! So, diving into the EMA (Exponential Moving Average) and MACD (Moving Average Convergence Divergence) duo – they might seem like twins from a distance, but let's break it down.
First off, EMA is a type of moving average that puts more weight on recent prices. It reacts faster to price changes compared to a Simple Moving Average (SMA), making it more responsive to current market conditions.
Now, MACD, on the other hand, is a trend-following momentum indicator. It's made up of two lines – the MACD line (the difference between a short-term EMA and a long-term EMA) and the Signal line (a 9-day EMA of the MACD line). MACD helps identify potential changes in the strength, direction, momentum, and duration of a trend.
So, in a nutshell, EMA is a type of moving average that's quick on its feet and gives more importance to recent data, while MACD is an indicator that combines two EMAs to provide insights into trend momentum.
Even though they might appear similar on the screen, their functions and purposes in analysis differ. EMA is more about smoothing out price data, and MACD is all about spotting changes in trend strength. Hope that clears up the confusion!