 Earn Infinite Loyalty Rewards
 Dedicated FREE FOREX VPS
 Free FOREX Virtual Private Server
 MT4 Demo Contest, Get $500
 Sign Up for an Account, Claim 60% Deposit Bonus
 Send E-mail and Get Free Merchandise
 $1K Refer a Friend Bonus for Pepperstone Pro clients
XM offers exclusive indicators including Ribbon and Analyzer. They can help you analyze trends, volatility, support/resistance, and determine entry timing.
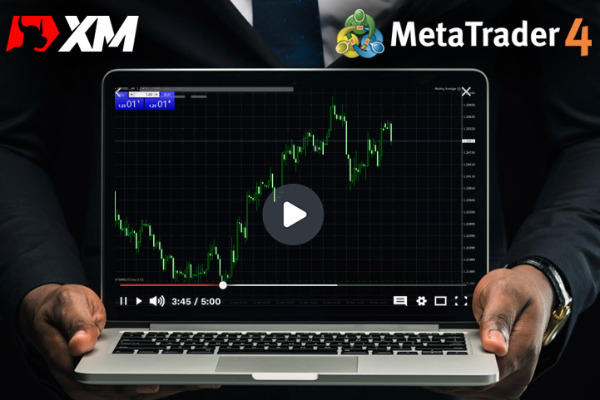
As a broker with more than a decade of experience, XM has become one of the best brokers for retail traders today. They offer a bunch of services, like different account types, lots of trading options, and good customer support.
In terms of trading analysis, XM broker offers exclusive indicators for its traders. These XM technical indicators are developed in collaboration with an experienced trader named Avramis Despotis.
- Ribbon Indicator: assists in identifying the present trend and determining the opportune moment to enter the market.
- River Indicator: determining the market direction and identifying the instruments that are gaining momentum.
- Ichimoku Indicator: assists in establishing support and resistance levels while also pinpointing the direction of the trend.
- Bollinger Bands Indicator: evaluates price volatility and anticipates potential trends in the market.
- ADX and PSAR Indicator: helps gauge the strength of a trend and identify potential points at which it could shift direction.
- Analyzer Indicator: facilitates the automated analysis of various indicators.
What's cool is that they work seamlessly with both MT4 and MT5, so you can even use them to create expert advisors or robots.
How to Request the Indicator?
- To obtain these XM exclusive indicators, start by signing up with XM and opening an account. Please go to the official XM page, select "Research & Education" at the top, and choose "trading tools."
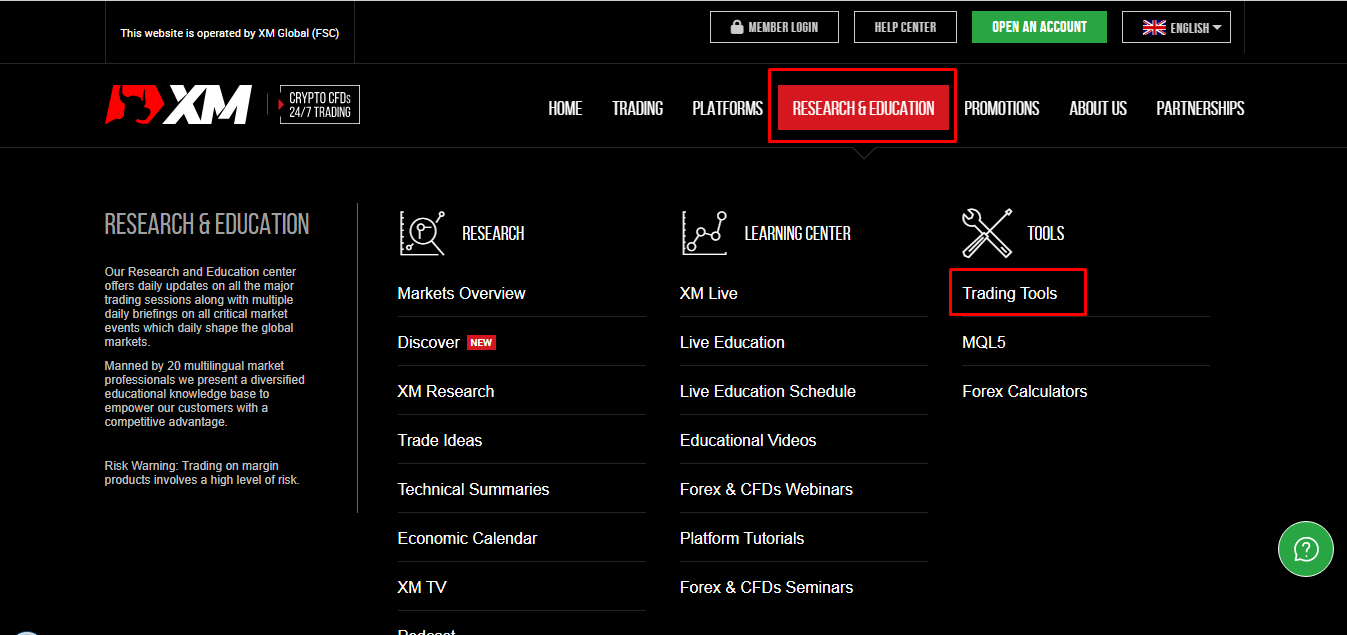
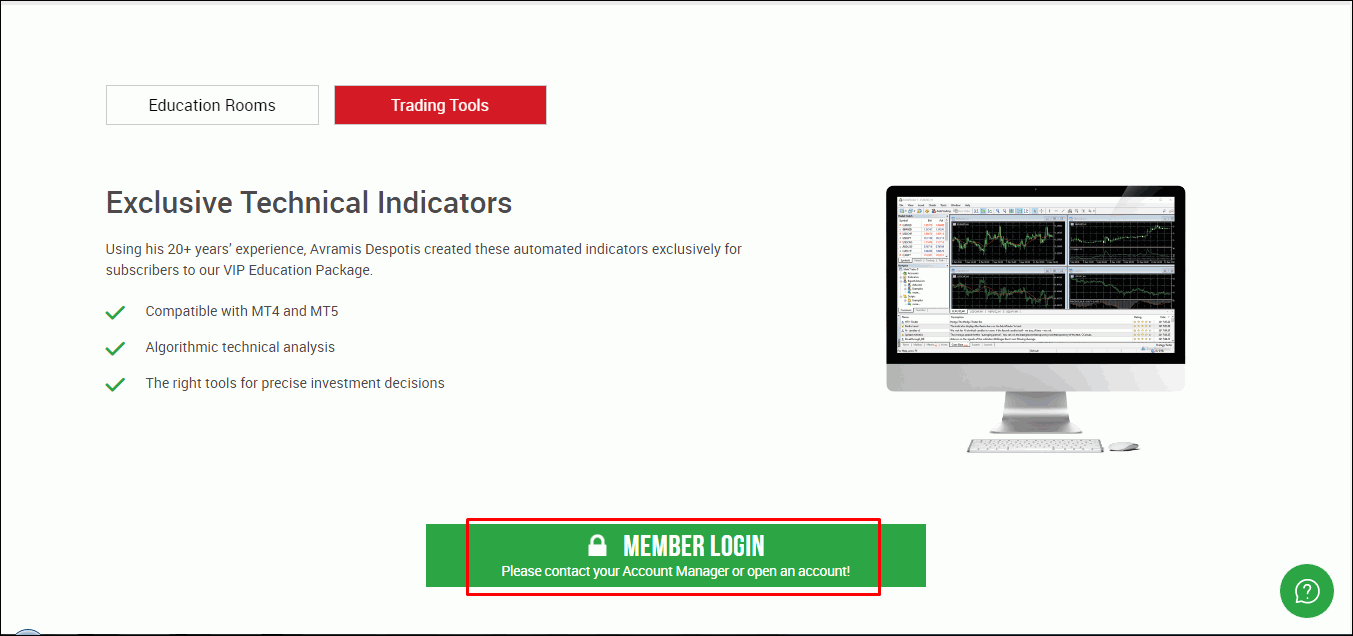
- Once you're on the trading tools page, click on "Member Login" in the green box at the center. This will take you to the registration or new XM account opening page. Complete all the required information for the account opening.
- Once you're signed up, expect a call from an XM Account Manager. During this talk, feel free to ask for the exclusive indicator.
- If you miss the Account Manager's call, don't worry. You'll either get an email from support or a call from another account manager. Keep that contact number handy, usually starting with 021. If you can't remember the account manager's email, just jump on XM live chat and ask to be contacted.
For those who already have an XM account, hit up customer service directly. Request to chat with an Account Manager.
The Account Manager will tell you what you need to do to get these MetaTrader indicators. Once you've done that, the account manager will guide you through claiming it.
More paperwork comes later after you've let them know what you need for the indicator claim. You can request more than one XM trading tool if your deposits meet the requirements.
General Requirements
The general requirements are that you need to deposit $250 to access the LITE features for each XM indicator. For PRO features, a deposit of $500 is required for each indicator (applies in multiples and is calculated per account, with a maximum of 2 weeks after the deposit).
The difference between LITE and PRO is that LITE can only be loaded for one chart. Meanwhile, PRO can be used for 2-3 charts. In LITE, only standard information is displayed, while PRO provides additional analysis.
XM Group is a group of regulated brokers and it is owned by Trading Point Holdings Ltd. Entities under XM Group have significant experience as financial services providers worldwide.
Trading Point of Financial Instruments Ltd was established in 2009 with headquarters in Limassol, Cyprus, Trading Point of Financial Instruments Pty Ltd was established in 2015 with headquarters in Sydney, Australia, XM Global Limited was established in 2017 with headquarters in Belize and Trading Point MENA Limited was established in 2019 with headquarters in Dubai.
XM Group is regulated by the CySEC (Cyprus Securities and Exchange Commission) - Trading Point of Financial Instruments Ltd, FSC (Financial Services Commission) – XM Global Limited, the ASIC (Australian Securities and Investments Commission) - Trading Point of Financial Instruments Pty Ltd and DFSA (Dubai Financial Services Authority) - Trading Point MENA Limited.
XM is one of the more experienced brokers in the world of online forex trading today. Since its founding, the broker has experienced a lot of changes, including the addition of the Ultra-Low Account and EN Live Edu that is instructed by 16 global experts.
In terms of trading instruments, XM is a well-known diverse class assets provider, varying from Forex, Crypto, Stock CFDs, Turbo Stocks, Commodities, Equity Indices, Precious Metals, Energies, & Shares. XM prides itself to be the ideal broker in trading execution, offering a stat of 99.35% orders to be executed in less than 1 second. Trading in XM would be also provided with a strict no requotes policy, no virtual dealer plug-in, no rejection of orders, real-time market execution, and the choice for traders to place orders online or by phone.
Spreads on all majors can reach as low as 0.6 pips in Ultra-Low Account, while spreads on other accounts usually start from 1 pip.
To protect the client's fund in the event of extreme volatility, XM presents each account type with Negative Balance Protection. Minimum deposit of $5 applies to Standard, Micro, and also Ultra-Low Accounts. Traders who open accounts in XM are enabled a condition similar to a Cent Account environment in the Micro Account, in which the Contract Size for every lot is only 1,000 units. If it is applied with the smallest lot size in the MetaTrader platform which amounts to 0.01, it means that traders can go as small as 10 units per trade.
For the deposit, XM applies zero-fee deposits in most of its available payment methods. Traders can choose to fund or withdraw their accounts via wire transfer, credit card, as well as the most favorable e-payment choices like Skrill, Neteller, and FasaPay.
To give their clients the best experiment in trading, XM has given access to both MT4 and MT5 platforms, each is available for more than 6 display formats (PC, Mac, Multiterminal, WebTrader, iPad, iPhone, Android, and Android Tablet).
All in all, there is no doubt that XM has gone global with its deep commitment to providing services in more than 30 different languages across the world. Aside from easing traders' experience with mainstream trading platforms and high-quality trading execution, XM is open to various types of traders, from small capital traders to the more experienced ones with big deposits at the ready. Traders are even provided with a Cent Trading environment should they choose to register under Micro Account.
For their global approach, XM has ensured that traders from various countries could access their service easily. This results in the provision of different domains specified for traders in certain jurisdictions. For example, traders from Indonesia could access XM via this link.
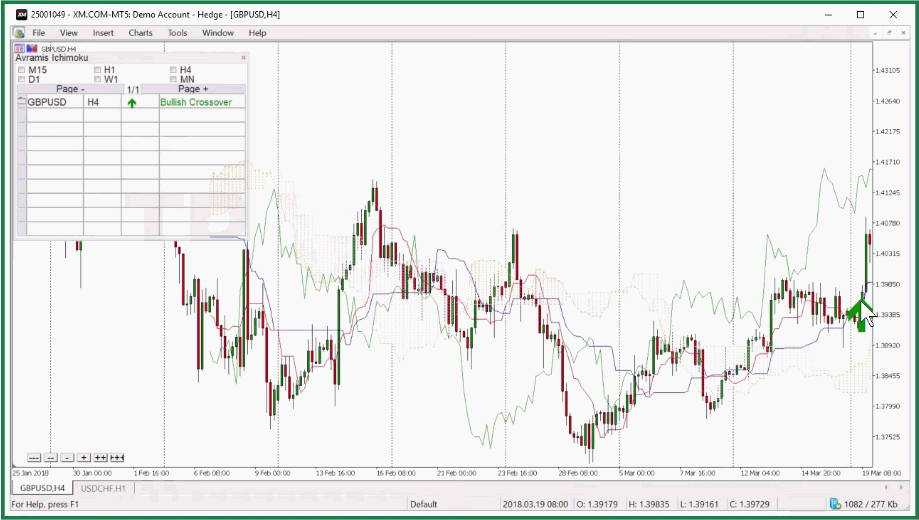
XM's Ribbon Indicator
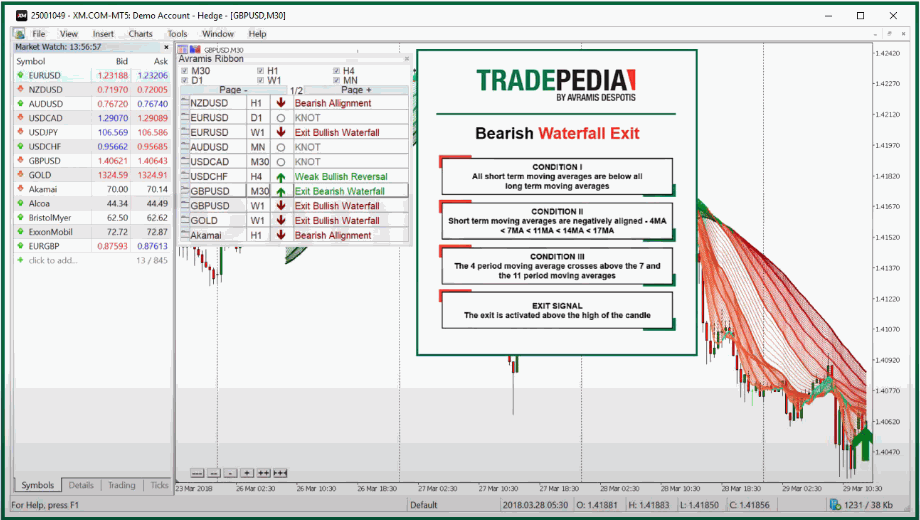
The Ribbon indicator helps spot the current trend and decide when it's a good time to jump into the market. It's made by combining ten moving averages with different timeframes.
Signals pop up based on how these moving averages line up. This indicator can give you a heads-up about when a trend might flip or if it's a good time to stick with it.
With the Ribbon indicator from XM, you can do these things:
- Stick with the trend using lots of moving averages. Just look at the ribbon lines – if prices are above, the upward trend is on, and if they're below, the downward trend keeps going.
- Find important consolidation areas and time your entry when things break out. Check where prices go up and down along the ribbon lines – that's the consolidation. When prices break out and move consistently, either up or down, it's time to enter.
- Catch signals that show the trend is still going. Similar to point 1, as long as prices stay above or below the ribbon lines, the trend keeps rolling.
- Check out a bunch of instruments fast and find hints about when to jump in. You could check the overview table that resumes all Ribbon signals across many instruments of your choice. This allows you to review opportunities from other pairs without having to jump in each pair's chart one by one.
XM's River Indicator
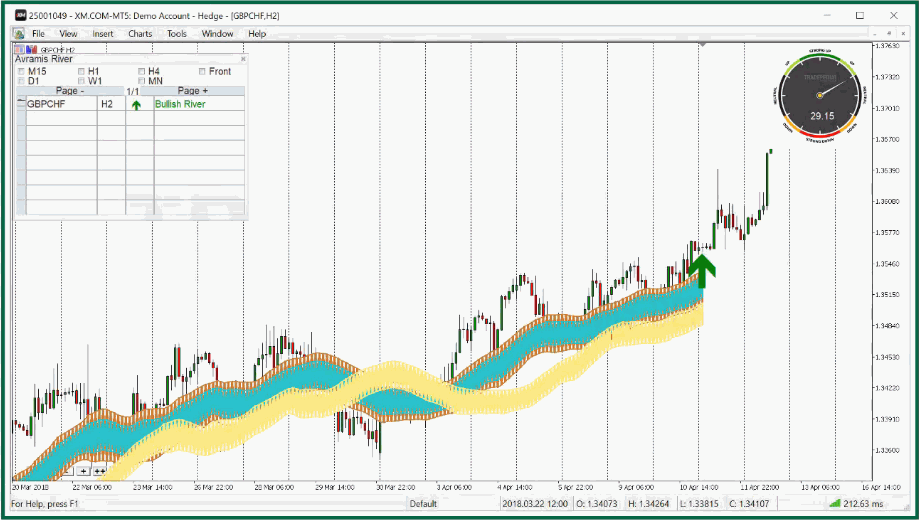
The River Indicator is a powerful tool that helps you figure out where the market is going and which instruments are really on the move. It's not just about knowing there's a trend; it also looks at how clear, strong, and wide that trend is.
As a matter of fact, the River Indicator combines different things like moving averages, market excitement, and how prices relate to them.
Here's what the XM River Indicator can do for you:
- Easily identify range patterns: The River Indicator is great at finding range patterns in the market, making it simple to see when the prices are staying steady or getting active.
- Replacing many trend indicators with just one: Instead of using a bunch of tools to understand trends, the River Indicator combines all that info into one easy-to-use tool. This makes it much simpler to understand which way the market is going.
- Finding instruments with really strong trends: You could compare multiple pairs' signals in one overview table so you don't have to visit each chart to draw the conclusion on the overall market condition.
XM's Ichimoku Indicator
The Ichimoku Indicator helps you define support/resistance and identify trend direction. It also helps gauge momentum and provide buy and sell signals.
With the XM Ichimoku indicator, you can do these things:
- Find markets that are moving strongly: You can do this by observing how the cloud relates to the moving price; a clear upward trend is when the price is well above the cloud, and a downward trend is when the price is significantly below the cloud.
- See where prices might bounce up or down using: In this case, the cloud serves as a level indicating potential bounce points.
- Decide when to jump into the trend: Watch for signals like price reversals and the initiation of a trend from Tenkan-sen, Kijun-sen, or TK crossovers.
- Check out other instruments effectively: You can quickly look at many instruments and find hints about when it might be a good time to jump in from the overview table on the upper left side of the chart.
XM's Bollinger Bands Indicator
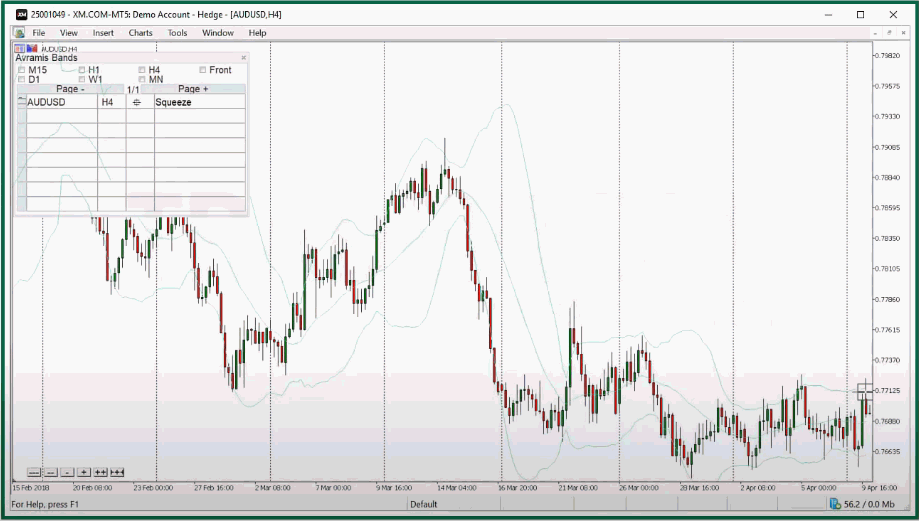
XM Bollinger Bands Indicator helps you to assess price volatility and potential market trends. With this indicator, you can:
- Recognize extreme price levels: When prices touch or surpass the outer bands, it suggests that the market is overbought or oversold.
- Identify signals in a ranging market: In a sideways or ranging market, prices tend to fluctuate between the upper and lower bands. Buying near the lower band and selling near the upper band can be a strategy for capturing profits within a range-bound market.
- Outline extreme price moves: Sudden expansions of the bands indicate increased volatility, potentially signaling the beginning of a strong trend. This can be particularly useful for trend-following traders looking to capitalize on significant price movements.
- Scan multiple assets in seconds and identify potential entry signals: Traders can quickly scan through various XM instruments with the overview table. This can save time and allow for a systematic approach to identifying opportunities across different assets.
XM's ADX and PSAR Indicators
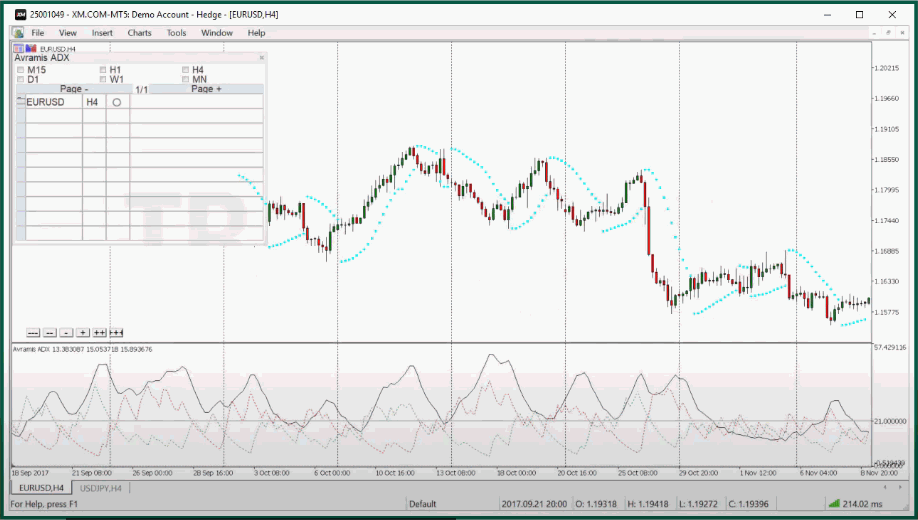
The ADX and PSAR indicators help you figure out how strong a trend is and when it might change direction. When you use both indicators together, you can avoid getting confused by false signals and make smarter decisions about where to put your money.
With this XM indicator, you can do these things:
- Recognize when a market is in a range: The ADX and PSAR indicators work together to show when the market isn't going up or down a lot. This is important because it means there's no clear trend.
- Identify the starting point of a new trend: When the ADX starts going up, it means the trend is getting stronger. At the same time, the PSAR might change its position around the price, suggesting a possible change in direction. When you see these signals together, it helps you catch the start of a new trend early on.
- Identify when the trend is reaching extreme conditions: If the ADX value goes really high, it shows that the trend is getting stronger. But if it goes too, too high, it might mean the trend has gone too far and could turn around. With the PSAR helping out, you can figure out if a trend is getting too extreme.
- Examine various trading instruments at once. With this XM indicator, you don't have to sweep every chart to check out other pairs' technical outlooks. As a matter of fact, you can see the summary in the overview table.
XM's Analyzer Indicator
Analyzer Indicator helps you with automated analysis of multiple indicators. You can analyze any instrument using Moving Averages, MACD, Relative Strength Index, and more at the click of a button.
With this XM indicator, you can:
- Analyze in seconds, not hours: the automated analysis feature allows for a rapid assessment of multiple indicators at once.
- Map the market direction in real time: This indicator provides a dynamic map of the market direction to help you stay updated on the latest market trends and shifts.
- Quickly identify the best instruments to trade: By assessing a range of indicators simultaneously, you can swiftly pinpoint assets showing favorable conditions
Pros and Cons of Using This Tools
Using XM's exclusive indicators comes with both pros and cons. Here are some of them.
✔️Pros | ❌Cons |
You can quickly spot trading signals. | When compared to numerous free and effective MetaTrader indicators, this indicator comes with a higher price tag. |
You have the option to develop a robot or expert advisor by blending these indicators. | The accuracy of trading signals with this tool varies based on market conditions. To achieve precise entries, consider incorporating additional filtering strategies. |
Rarely used by other traders, giving it an exclusive feel. | There's limited educational content or information about these indicators available on the internet. |
Conclusion
XM exclusive indicators' main advantage lies in its user-friendly design, including the overview table and pop-up notifications for valid signals. This makes it easier to check across multiple assets all at once and so advances your trading process.
Yet, the main thing about the indicator is its precise accuracy. How well this indicator performs relies on how skillfully a trader selects the right market conditions. For instance, trend indicators like the Ribbon and River work best in trending markets but not so well in sideways markets.
For beginners, this indicator could be a useful tool. But in my personal opinion, putting in a minimum of $250 for each indicator doesn't seem worthwhile. There are plenty of free MetaTrader indicators online that work just as well.
Nevertheless, there's no harm in trying XM exclusive indicators if you're curious, have weighed on the pros and cons, and don't mind the cost.
XM is a well-regulated forex brokerage that offers a wide range of trading instruments, including forex, CFDs, stocks, indices, commodities, and cryptocurrencies. XM also offers a variety of educational resources, including webinars, tutorials, and e-books. These resources can help traders learn about the forex market and how to trade.


10 Comments
Jack
Nov 28 2023
Hello, I must say, it's a fantastic article. I have a keen interest in indicators, so stumbling upon this piece got me quite intrigued. I usually incorporate multiple indicators in my trading strategy as I've found that combining them tends to enhance overall accuracy.
By the way, this indicator seems quite expensive, $250 for the LITE version alone. Is the indicator genuinely accurate, and is that why it's priced high? Could you help by providing complete accuracy data for using this indicator?
Also, are there any indicators that work similarly but are free or more affordable?
David Tristan
Nov 29 2023
Hello! Regarding the specific indicator you mentioned being priced at $250 for the LITE version, it's important to note that the cost of indicators can vary, and pricing is often determined by factors such as features, capabilities, and perceived value. The price may not necessarily reflect the accuracy of the indicator.
Unfortunately, there is no specific data on the accuracy of this particular indicator or its complete accuracy data. It's advisable to seek reviews, testimonials, or performance data directly from the indicator provider or the trading community to assess its effectiveness.
As for alternatives, there are many free or more affordable indicators available, although their features may vary. Platforms like TradingView often provide a wide range of free indicators, and you can explore community-contributed scripts. Keep in mind that the effectiveness of an indicator depends not only on its cost but also on how well it aligns with your trading strategy and preferences.
If you have specific indicators or features in mind, you might explore open-source trading platforms or forums where traders share custom indicators. Additionally, some brokers offer built-in indicators or provide access to third-party indicators at more affordable prices.
Before adopting any indicator, it's crucial to test it thoroughly in a demo environment and assess how well it aligns with your trading goals. Always exercise caution and due diligence when investing in or using paid indicators.
If you have further questions or if there's anything else you'd like assistance with, feel free to ask. Happy trading!
Brenda
Nov 29 2023
It's interesting that you brought up Bollinger Bands and Ichimoku indicators, as they are indeed default indicators in MetaTrader. In my Metatrader platform, I've noticed that Bollinger Bands and Ichimoku are readily available without the need to download them separately.
How do they differ from the built-in indicators in Metatrader 4, if at all? If so, what are the differences?
I'm also curious about the ADX and PSAR indicators provided by XM. Are these indicators similar to the default ones in Metatrader, or does XM offer any modifications or improvements?
David Tristan
Nov 30 2023
The indicators provided by XM are custom indicators developed by Tradepedia, a leading financial education provider. These indicators are specifically designed to enhance the trading experience for XM clients. Let's explore the differences between XM versions of Bollinger Bands and Ichimoku and the default indicators in MetaTrader 4, as well as the ADX and PSAR indicators:
XM Exclusive Bollinger Bands vs. Default Bollinger Bands (MT4):
Default Bollinger Bands (MT4): In MT4, Bollinger Bands consist of a middle band (simple moving average) and two outer bands representing standard deviations. They help identify overbought or oversold conditions and potential reversal points.
XM Exclusive Bollinger Bands: The Bollinger Bands are the same, but this indicator works in all time frames and across different pairs. It means you get the many signals of the Bollinger bands without putting the indicator for each pair.
XM Exclusive Ichimoku vs. Default Ichimoku (MT4):
Default Ichimoku (MT4): MT4's default Ichimoku indicator includes components like the cloud, Kijun Sen, Tenkan Sen, and Chikou Span. It offers a comprehensive view of market trends and potential support/resistance levels.
XM Exclusive Ichimoku: XM Exclusive Ichimoku is still the same but the Ichimoku works across different pairs and different time frames.
ADX and PSAR Indicators by XM vs. Default in MetaTrader 4:
Default ADX and PSAR (MT4): In MT4, ADX measures the strength of a trend, while PSAR helps identify potential reversal points. These default indicators serve as valuable tools for trend analysis.
XM ADX and PSAR: XM's versions of ADX and PSAR may offer modifications or improvements, such as adjusted default parameters or additional features. These enhancements could contribute to a more tailored and precise analysis.
To gain a detailed understanding of the unique features and modifications introduced by Avramis (XM) indicators, it's recommended to consult the official documentation provided by XM or Tradepedia. Additionally, you may find insights into the indicators' functionalities through user guides, webinars, or direct support from XM.
Always practice due diligence and consider testing any new indicators in a demo environment before integrating them into live trading strategies. This approach allows you to assess their effectiveness and suitability for your specific trading style. If you have further questions or need additional information, feel free to ask!
Bruno
Dec 1 2023
For the ribbon indicator, in the overview box, there is information about what signal it is and in which time frame. If, for example, on the same pair, there are two opposing signals in different time frames, which one should we follow?
David Tristan
Dec 5 2023
Generally, signals observed on higher time frames tend to carry more weight and are considered more influential in shaping the overall trend direction. For instance, a signal identified on the daily chart is accorded greater significance than a signal on a shorter time frame, such as the 15-minute chart.
It is a common practice among traders to prioritize signals on higher time frames when determining the broader trend direction and potential long-term market movements. These signals offer a more comprehensive view of market dynamics and are often associated with more sustained and impactful trends.
Gabriel
Dec 1 2023
I like the appearance of the river indicator; it looks more pleasing, especially during a clear trend. Regarding entry signals, there is already a table indicating the signals and on which time frame.
Since I've been waiting for a pullback, is it possible to enter when the price pulls back to the river indicator even if the signal hasn't appeared yet?
David Tristan
Dec 7 2023
Entering a trade during a pullback allows for a potentially early entry point. However, it comes with the inherent risk that the anticipated signal may not materialize, leading to a trade without full confirmation.
While early entry may expose you to increased risk, it also has the potential for a more favorable risk-reward ratio. If the anticipated signal aligns with the subsequent trend, entering during a pullback could offer an advantageous entry point.
The solution is to use other indicators or tools to confirm the potential trade. This type of indicator is a momentum indicator like MACD or stochastic. If these indicators support the idea of an imminent trend continuation during the pullback, it could strengthen the case for an early entry.
Bertha
Dec 2 2023
For the ADX and PSAR indicators, what is the benchmark number for ADX that indicates a strong trend?
Typically, I see traders using a figure above 25 as a benchmark for a strong trend, while a figure below 25 indicates a weak trend.
David Tristan
Dec 9 2023
In this case, the number for both versions (default vs XM) is the same. Both use 25 as the standard.
A reading above 25 on the ADX is commonly considered indicative of a strong trend. Traders interpret this as a sign that the market is in a trending phase, whether it's an uptrend or a downtrend.
Conversely, an ADX reading below 25 suggests a weak or absent trend. In such cases, the market may be experiencing ranging or consolidating conditions rather than a well-defined trend.