 Dedicated FREE FOREX VPS
 Free FOREX Virtual Private Server
 MT4 Demo Contest, Get $500
 Sign Up for an Account, Claim 60% Deposit Bonus
 Free MT4/MT5 VPS 2024
 Send E-mail and Get Free Merchandise
 $1K Refer a Friend Bonus for Pepperstone Pro clients
 Maximize Your Earnings with 100% Deposit bonus
 Trade to Win, $5,000 Monthly Demo Contest
 Claim 30% + 15% Deposit Bonus from LiteFinance
MACD or Moving Average Convergence-Divergence is one of the most popular technical indicators for its multiple benefits, from identifying entry opportunities to divergence trading. How to use it effectively?
The MACD indicator can help traders avoid making entries or exits too early. When other indicators or even the price action shows a signal, MACD warns traders to wait and prevents them from getting trapped by the reversed trend direction.
Many professional traders in the stock market, forex, commodities, and other assets rely on MACD signals. Still, knowing that MACD is not the "holy grail" indicator that should be trusted 100% is essential. After all, the indicator is still based on past prices and thus can be unreliable at certain market conditions.
Contents
How Does MACD Look?
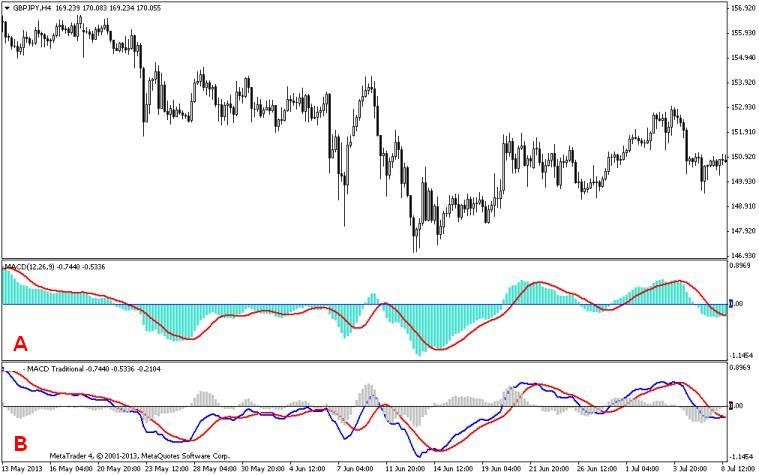
The two most common MACD layouts are displayed in the following chart. A is for the popular standard version of MACD in the MetaTrader platform. It consists of MACD signal charts and histograms. Meanwhile, B is the traditional version which consists of MACD charts, signal charts, and Oscillator Moving Average (OSMA) in the histogram (MACD value minus the signal).
Despite the visual differences, both types of MACD have the same ability to provide ideal information about price trends, overbought and oversold signals, divergence indications, and so on.
MACD Parameters
Gerald Appel, a trader and analyst who built the MACD indicator, defined the difference between Exponential Moving Average period 12 (EMA-12) and EMA-26 as the basis for generating the signals. This results in the formation of MACD's main line. On the traditional MACD layout, the signal line is a moving average of MACD-9.
As a trader, you might not need to know the calculation of the MACD parameter, but if you want to program and modify an EA (Expert Advisor), you must know how to calculate these parameters:
- MACD main line: EMA (Close, 12) - EMA (Close, 26)
- Signal line: SMA (MACD 9)
- Histogram Oscillator Moving Average (OSMA): MACD main line - signal line
On the MetaTrader platform, the main line is shown as a histogram, and the signal line is in the form of a chart. Meanwhile, OSMA is shown as a separate indicator. On other trading platforms, MACD's main and signal lines may be shown in one chart along with the OSMA.
How to Use MACD: The Simple Way
The extended version resembles the MetaTrader platform layout; the histogram has two distinct colors to differentiate the bullish and bearish signals. In its implementation, the Extended Version does not show the signal line (SMA is set to 0). However, it can be shown if you need it by setting the SMA signal to 9.
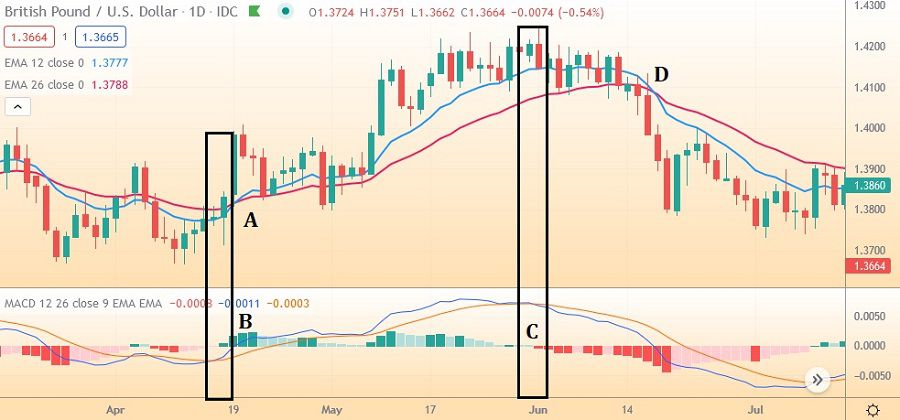
In the picture above, you can see a strong trend along with EMA-12 and EMA-26 lines that are getting wider in some places. If you compare it with the MACD histogram, the EMA widening usually ends with a crossing that aligns with the histogram's change of position from the 0 levels.
This is indicated by the yellow lines that highlight the crossing of EMA lines and the position change in the MACD histogram. The blue histogram shows a strong bullish sentiment, and the red one shows a bearish sentiment.
Based on the trading rules for the intersected two moving average lines, there are two ways to interpret the signals:
- Buy signal can happen if the EMA-12 line crosses the EMA-26 from below or the MACD is bigger than zero.
- Meanwhile, the sell signal happens when the EMA-26 line crosses EMA-26 from above, or the MACD is smaller than zero.
With the colored histogram, you can also anticipate the buy signal earlier when the bullish sentiment is strong (A area). Both EMA lines intersect, and MACD is above the 0 levels (B area).
A similar thing happens for the sell signal anticipation; when a bearish sentiment can be detected earlier in the C area, which is eventually followed by a decline from the price chart after the EMA lines crossing (D area).
If you are an aggressive trader, you can make a buy entry when the MACD is in the C area. There is no need to wait for the EMA lines to cross (D area). However, confirming the signals with price action or other indicators is better to get better profitability.
MACD Prevents Trading Against the Trend
As mentioned before, the MACD indicator can help us avoid losses caused by trading against the trend. What happens frequently is when the candlestick formation and trend indicator (such as Bollinger Bands) show a trend reversal, MACD usually shows the opposite.
You can anticipate opening trades based on a price action method without MACD indicator assistance. Yet, you should know that price action analysis is tricky and very subjective. It also needs adequate experience to understand the price patterns correctly. In this case, the MACD indicator can help to anticipate the trend movement.
The following is a trend reversal signal by Bollinger Bands and a candlestick pattern:
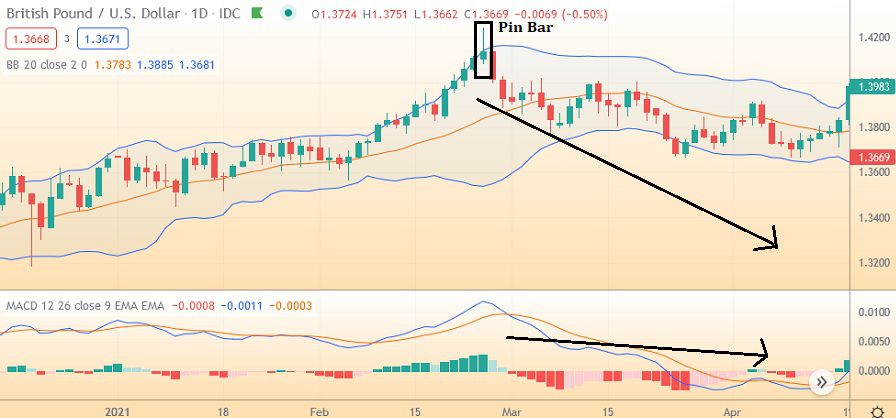
The candlestick pattern shows a pin bar formation (reversal). The price and the MACD histogram start to go down after the bar's lowest price is re-visited. They go together with the breakout from Bollinger bands. It is then safe to assume that a reversal to the downside will be formed. This setup is perfect for opening a sell entry with a stop loss above the pin bar's high.
However, it would help if you were careful with the probability of the price moving higher after the pin bar formation. It could happen when the MACD histogram continues to make higher highs instead of dwindling.
You would not make the mistake of making a sell position if you paid attention to MACD and not be blinded by the confluence of the pin bar and Bollinger Bands' indications. In other words, the MACD indicator is useful in warning you not to trade against the trend.
Overbought and Oversold
Overbought occurs when the histogram line is above the zero levels (positive) and the length of the bars decreases after peaking. Conversely, the oversold happens when the histogram line is under the zero level (negative) and the length of the bars shorten after bottoming to a certain point.
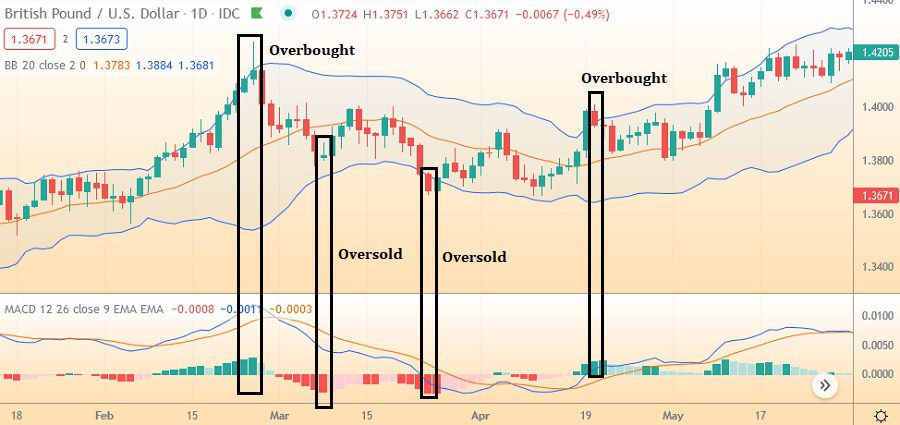
The price decreases after rising and reaching the upper band of the Bollinger Bands. This happens when the MACD shows an overbought condition in which the histogram bars have peaked and start declining afterward. On the other hand, price reversals around the lower band of Bollinger Bands can be confirmed with MACD bars that bottom down under the 0 level.
How to Use MACD's Signal as a Confirmation
As discussed in advance, MACD may help in confirming the trend direction. Traders wait for one or two bars of the histogram before deciding to make an entry. It is not only for the trending market but also for helping to confirm the ranging market where the overbought and oversold signals can be optimized.
Nevertheless, the MACD indicator must be used only as a confirmation tool. The main indicator is the price action from the chart trading and other technical indicators you usually use, such as moving average or Bollinger Bands.
The most frequent combination used is of price action, trend line, and MACD indicator. The MACD confirmation is in the breakout of the support or resistance level. The example is as follows:
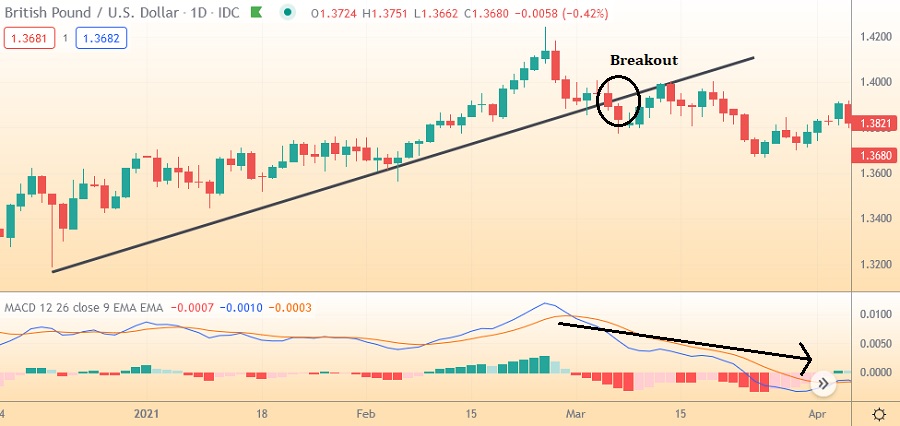
The trend line in the above picture serves as a valid support line. You need to wait for the breakout on the support line before opening a sell position. The MACD indicator supports that notion as the bars have formed a higher high before heading lower, indicating that the price is overbought.
When the price does break the support line and is closed below it, the MACD histogram confirms the reversal by showing declining red bars. The sell position can be triggered on the next candle opening, with the price above the trend line as the stop loss.
Convergence and Divergence
Convergence -Divergence terms in MACD mean comparing the price movement and the MACD indicators (in lines or histogram). Convergence means "the meeting of price and the MACD line or histogram." The points are seen as if they are about to meet or converge.
Meanwhile, the divergence happens when the price and the MACD indicator signal seem to move away from each other, thus creating a divergence.
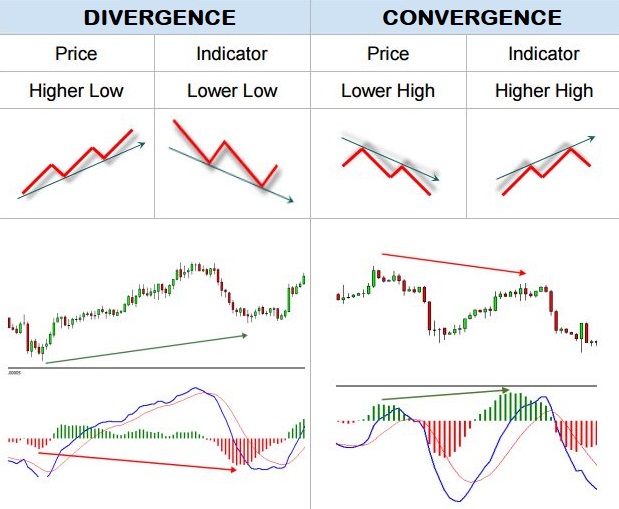
The rules of trading with divergence and convergence are that the price movement will eventually change and follow the direction of the MACD indicator movement. However, it would be best if you did not carelessly make an entry as soon as you see a convergence or divergence. You need to confirm the signal with price action or other indicators.
Forex traders are generally used to oscillator indicators such as MACD, RSI, CCI, Stochastic, and so forth. Even in a forex demo account platform, those indicators are commonly known for their oscillating levels. However, many of them do not have the idea about the alternative ways of using a MACD indicator. For an easy guide of using MACD as a trend indicator, check out Predicting Trends Using MACD in Forex Trading.


2 Comments
Alex
Apr 6 2024
Hey, I'm curious about the MACD Indicator and specifically, I want to dive deeper into understanding the Histogram Oscillator Moving Average (OSMA): specifically, how it relates to the MACD main line and the signal line.
I find the MACD to be quite complex and still struggle to grasp its full functionality. So, I'm particularly interested in understanding the role of the OSMA within the MACD framework. What exactly is its function, and what is its primary purpose in the context of MACD?
Hans
Apr 9 2024
Hey there! So, you're wondering about the MACD Indicator and specifically, the Histogram Oscillator Moving Average (OSMA) and how it fits into the MACD picture. Yeah, MACD can seem pretty confusing at first, but don't worry, we'll break it down. The OSMA essentially represents the difference between the MACD main line and the signal line. It's like a visual representation of the distance between these two lines.
You can see the OSMA and MACD in this picture :
Now, the main purpose of the OSMA within the MACD framework is to provide additional insight into the momentum of price movements. By analyzing the changes in the OSMA over time, traders can gain a better understanding of whether momentum is increasing or decreasing, which can help inform their trading decisions. So, while MACD might seem daunting, understanding the role of the OSMA can definitely make it more manageable.