 Dedicated FREE FOREX VPS
 Free FOREX Virtual Private Server
 MT4 Demo Contest, Get $500
 Sign Up for an Account, Claim 60% Deposit Bonus
 Free MT4/MT5 VPS 2024
 Send E-mail and Get Free Merchandise
 $1K Refer a Friend Bonus for Pepperstone Pro clients
 Maximize Your Earnings with 100% Deposit bonus
 Trade to Win, $5,000 Monthly Demo Contest
 Claim 30% + 15% Deposit Bonus from LiteFinance
Divergence is one of the most popular ways to use indicators and identify trend reversals. How does it work and what are the crucial things to consider?

In a trading strategy, many factors come into play. Apart from fundamentals, traders can also use technical analysis to determine what might happen to the price in the future.
In a technical perspective, divergences are significant for determining the trend's strength and indicating a trend reversal. Therefore, this strategy suits counter-trend traders to determine good trading opportunities. Here, we will explore the facts about divergence and how it can tell you about the direction of a trend.
Contents
What is Divergence?
Divergence is a technical analysis that shows when the price of an asset is not in sync with the momentum of an oscillator. This can signify that the current trend is weakening and may be about to reverse.
There are two types of divergence: positive and negative. Positive divergence occurs when the price makes a new low, but the oscillator makes a higher high. This indicates that the bulls are gaining strength, and the bears are losing momentum. Negative divergence occurs when the price makes a new high, but the oscillator makes a lower low. This indicates that the bears are gaining strength, and the bulls are losing momentum.
Divergence is not a perfect indicator, but it can be a helpful tool for identifying potential trend reversals. It is important to use divergence with other technical analysis indicators and consider the overall market sentiment before making any trading decisions.
See Also:
Using RSI Indicator
Divergence works in any indicator, but some of the best indicators to use in divergence trading are RSI, Stochastics, MACD, and Trade Volume. We will use the Relative Strength Index (RSI) in this case.
The RSI indicator compares the average gain and loss over a certain period. For instance, if your RSI is set to 15, the indicator will compare the bullish and bearish candles over the past 15.
During trends, RSI can be used to compare individual trend waves to determine the trend's strength. The following are the three possible scenarios to consider:
- Usually, the RSI makes higher highs during healthy and strong bullish trends. It means there were more and bigger bullish candles in the recent trend wave than in the previous wave.
- The momentum will likely stay unchanged when the indicator makes similar highs during an uptrend. When the RSI makes an equal high, it does not qualify as divergence because it just means that the trend's strength is steady.
- If the price makes a higher high during a bullish trend, but your RSI makes a lower high, it means that the most recent bullish candles are not as strong as the previous price action, and the trend is losing momentum. This is what we call a divergence.
Tips on Divergence Trading
As we have mentioned before, the occurrence of divergence does not always mean a strong reversal. Often, the price enters a sideways consolidation after a divergence is formed. Remember that a divergence only signals a loss of momentum but does not necessarily identify a complete trend shift every single time.
To avoid misinterpreting the divergence, you should follow some of these tips:
Consider the Location
Location is an essential factor in many trading strategies. Adding the filter of location can enhance the quality of your signals and trades. So instead of taking trades based on a divergence signal, you can check and wait until the price moves into the previous support/resistance zone. You can only look for divergences and trend shifts to determine your entry point. A divergence occurring at a key support or resistance level is proven to be able to signal a stronger trend reversal.
Divergence Only Happens in 4 Different Price Scenarios
For the divergence to work, you must start somewhere and specify what you're looking for on the chart. It means focusing only on the necessary things and ignoring the rest. One of the critical rules in divergence strategy is that to make a divergence, the price must form one of the following scenarios:
- Higher high than the previous high
- Lower low than the previous low
- Double top
- Double bottom
If none of these four price scenarios happened, don't even consider the movement.
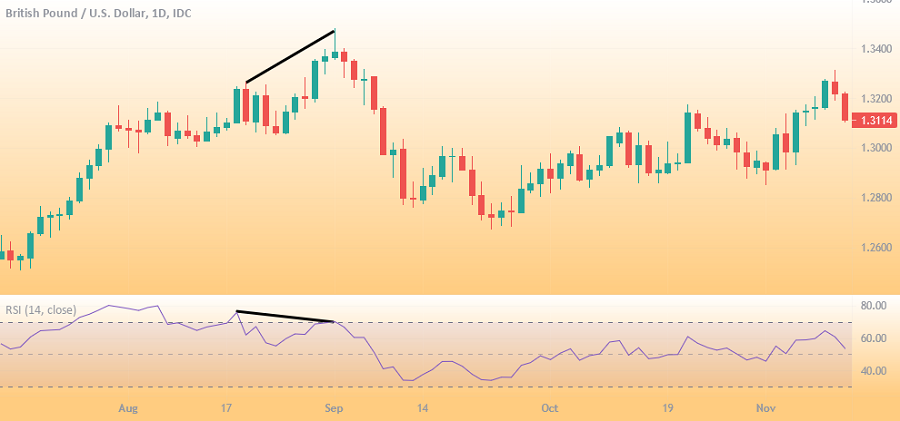
Draw a Line on the Top or Bottom
Now take a look at the price action. Remember, only four things matter, and only one can occur every time: a higher high, a flat high, a lower low, and a flat low.
Once you find the spot, the next step is to draw a backward line from that high or low point to the previous high or low. Remember that it has to be on successive major tops or bottoms. You should focus on this area, so if you see little bumps or dips between the two major highs or lows, you can ignore them.
Another important note is to be consistent with your lines. If you draw a line connecting the two highs on the price action, you must also make a line that connects the two highs on the indicator you use. The same goes for lines connecting the lows.
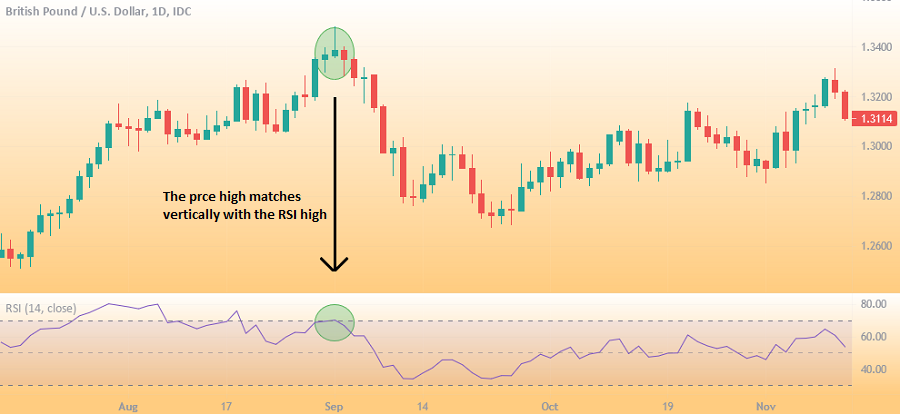
Maintain a Vertical Position
When you observe the price chart, always ensure the movement on the price action is aligned vertically with the indicator. Remember that the price and action, and indicator should be in sync, so it's essential to make sure that you're looking at the same price movement on both windows.
Watch the Slopes
While the setup of the price action and the indicator must be the same, the actual line movement must differ for a divergence. So that means a divergence only occurs when the slope of the line connecting the indicator is different from the slope connecting the price.
The easiest way to spot divergence is by looking at the slope or the direction of the line you've drawn. The slope can be ascending (rising), descending (falling), or flat.
Don't Be Late!
The best way to trade divergence is as soon as it happens. If you spot a divergence, but the price has already reversed and moved in one direction for some time, the divergence should be considered played out. And if the divergence is already played out, you're late to the party. Instead of chasing the divergence and risking your trade, it's wiser to wait for another swing high or low, to form and start your divergence search over.
Use Higher Time Frames
The divergence strategy works better in higher time frames because they give you more information to work with. As a result, you will get fewer false signals and increase your chance of winning. Our best recommendation to trade divergence would be to use the 1-hour chart or higher.
You can use shorter time frames, such as the 15-minute chart, but remember that the accuracy can be less reliable, although the divergences may occur more frequently.
Conclusion
Divergence is a great way to analyze the chart by using technical indicators. Alongside the support and resistance strategies, finding divergence can be used to improve your analytical skill and trading outcome. However, like all trading strategies, the divergence method is not risk-free.
No matter how powerful your indicator is, it would be best to protect yourself from the risk of speculation. While this strategy is simple in practice, it takes experience to master it fully. Always be careful when using this method, and do proper backtesting and combine it with other tools to confirm the signal before deciding to take action.


1 Comment
Ronald Merriweather
Jan 10 2024
The article is incorrect. Divergence occurs when in an uptrend, price makes a higher high on the chart and lower highs on the RSI. In contrast, it would be lower lows and higher lows for a downtrend. I would take this article with a grain of salt.