Dedicated FREE FOREX VPS
 Free FOREX Virtual Private Server
 MT4 Demo Contest, Get $500
 Sign Up for an Account, Claim 60% Deposit Bonus
 Free MT4/MT5 VPS 2024
 Send E-mail and Get Free Merchandise
 $1K Refer a Friend Bonus for Pepperstone Pro clients
 Maximize Your Earnings with 100% Deposit bonus
 Trade to Win, $5,000 Monthly Demo Contest
 Claim 30% + 15% Deposit Bonus from LiteFinance
Drawn correctly, trend lines could provide trading signals as accurately as technical indicators for forex traders.
The trend in forex trading refers to the direction of price movement. There are three types of trends to note, namely bullish (uptrend), bearish (downtrend), and sideways (ranging). However, the fact is that prices won't move straight in one direction. Therefore, traders have to learn how to draw trend lines in order to identify the current trend in the market.
Drawn correctly, trend lines could provide trading signals as accurately as technical indicators for forex traders. Some experienced traders can even actively trade daily using trend lines only. In addition, fundamental analysts often make use of trend lines to understand long-term trends. As such, every trader should be able to draw trend lines.
Step 1: Identify Supports and Resistances
Firstly, you have to spot highs and lows in the current time frame. These highs and lows would help you to identify supports and resistances. An easy example can be seen below.
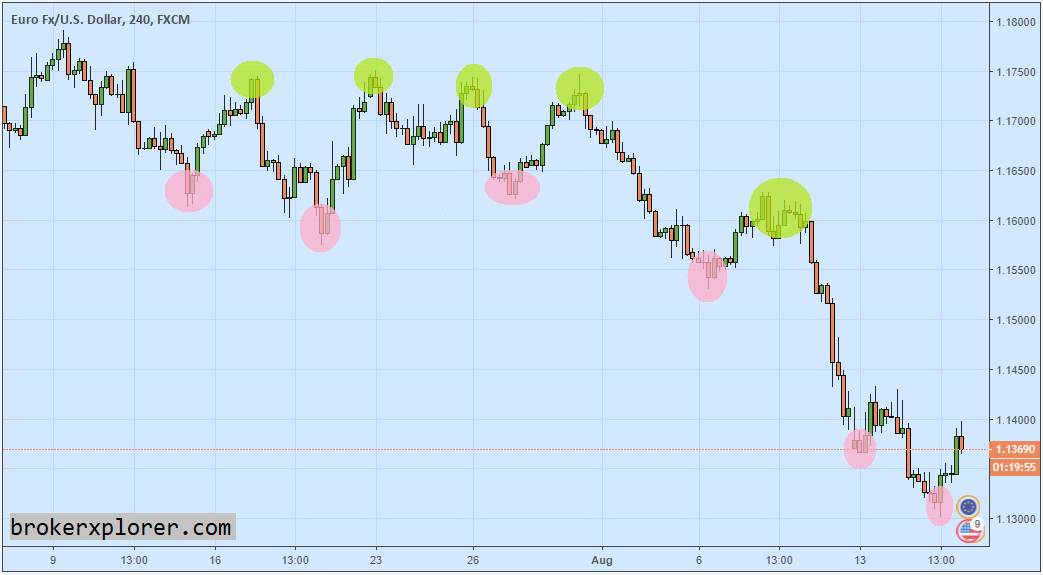
Note that the peaks marked in green represent resistances, while the troughs marked in pink represent supports. These benchmarks will be used to draw your trend lines.
Step 2: Draw Trend Lines to Connect Adjacent Resistances and Supports
After identifying resistances and supports, the next step is to draw the trend lines. Forex trading platforms such as MetaTrader are usually equipped with tools to draw trend lines. To use it, click on the symbol that represents the tool then follow this set of rules:
- Upper Trendline: Draw a line from one resistance to the nearest resistance. It takes a minimum of two resistances to draw this trend line. However, the more peaks that form one trend line, the stronger it is.
- Lower Trendline: Draw a line from one support to the nearest support. It takes a minimum of two supports to draw this trend line. The more troughs that form a trendline, the stronger it is.
Don't draw any trend line forcefully just so it could suit a certain shape or go in the direction you want. If it turns out that it is difficult to draw a certain trend line, then it may not be possible to draw it now; meaning that the market condition is uncertain (choppy).
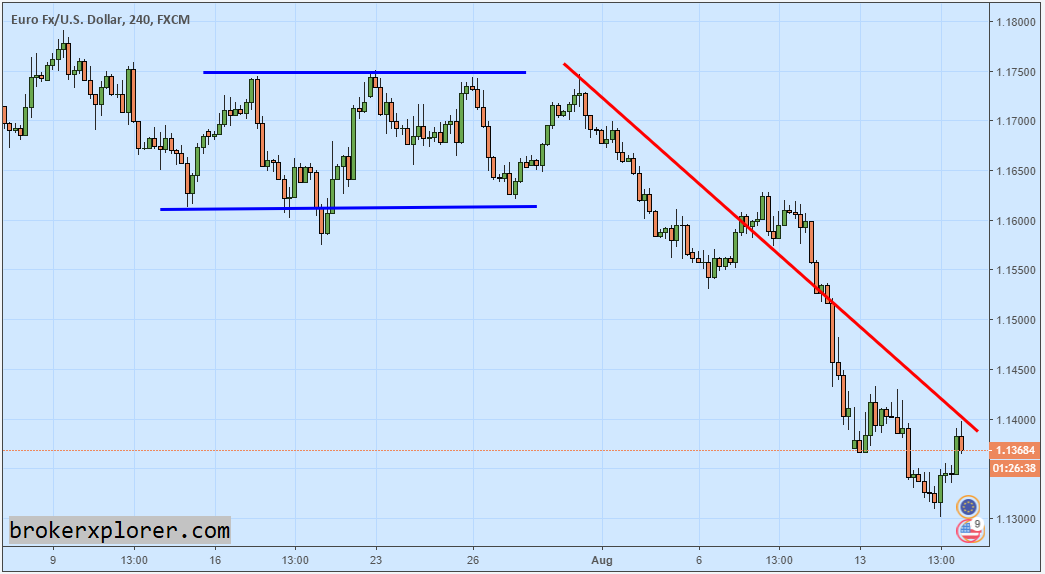
We can draw two trend lines on the EUR/USD chart above. The sideways trend is framed by the blue lines, while the bearish trend is indicated by consecutive lower highs (red line).
You can also draw several trend lines that overlap each other in one chart. For example, see the USD/CHF chart below:
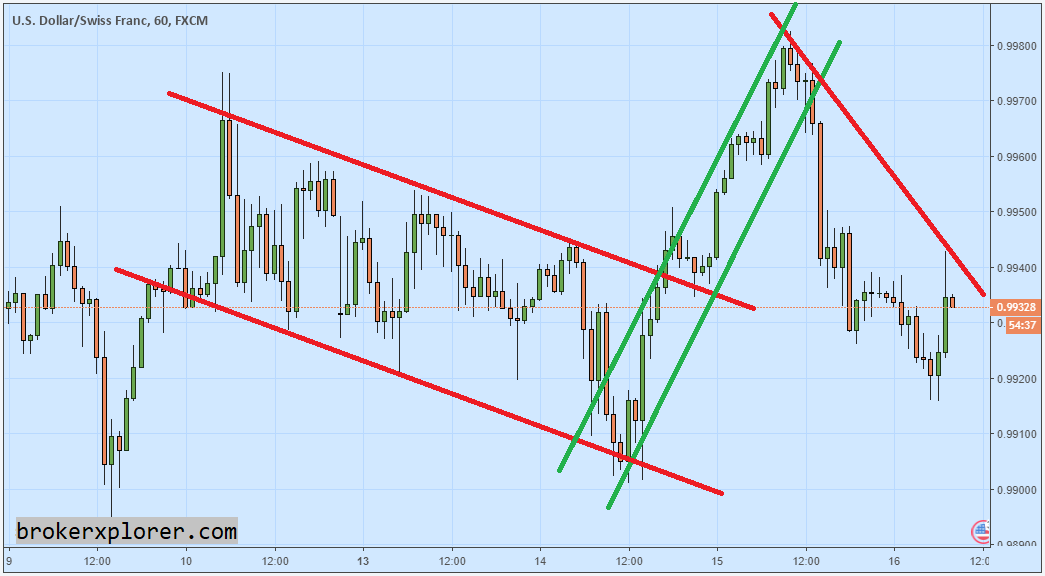
In the middle of the chart, the USD/CHF was bearish (red trend line). After prices broke above the trend line, movements turned bullish for a while (green trend line), then falls again. Now, USD/CHF is moving around 0.9932 after setting one resistance point, so we can draw a red trend line which indicates a downtrend again.
Step 3: Use Trend Lines to Trade Forex
Traders generally use trend lines as references to find bounces and breakouts. The golden rules are:
- If prices bounce from the upper trendline, it means that prices potentially fall to the lower trendline.
- If prices bounce from the lower trendline, it means that prices potentially rise up to the upper trendline.
- If prices broke out of the upper trendline when it is in a downtrend, then it might be the beginning of a bullish trend.
- If prices broke out of the lower trendline when it is in an uptrend, then it might be the beginning of a bearish trend.
To confirm bounces and breakouts, you can take advantage of other technical indicators. Otherwise, you can observe the development of candlestick patterns near the bounce and breakout points.