 Dedicated FREE FOREX VPS
 Free FOREX Virtual Private Server
 MT4 Demo Contest, Get $500
 Sign Up for an Account, Claim 60% Deposit Bonus
 Free MT4/MT5 VPS 2024
 Send E-mail and Get Free Merchandise
 $1K Refer a Friend Bonus for Pepperstone Pro clients
 Maximize Your Earnings with 100% Deposit bonus
 Trade to Win, $5,000 Monthly Demo Contest
 Claim 30% + 15% Deposit Bonus from LiteFinance
OHLC strategy is popular among day traders. What is the implementation of OHLC strategy, and how can it simplify day trading for you?
OHLC is a commonly used term among forex traders, and it holds great importance in forex trading. It provides information on the opening, highest, lowest, and closing prices of a currency pair during a specific time period.
Unfortunately, not all traders comprehend the purpose and tactics of using OHLC, particularly for day trading. Nonetheless, a suitable OHLC strategy can generate substantial profits for day traders. To gain a better understanding of this, a comprehensive review is provided below.
What is OHLC?
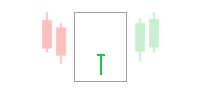
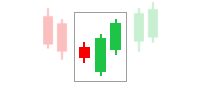
OHLC stands for Open, High, Low, and Close, and is an integral part of price charts. OHLC charts aid traders in interpreting price movements through the patterns they produce. The OHLC chart consists of four main data points during a single period, with the closing price considered the most important point by many traders.
Visually, the OHLC chart consists of a vertical line and two short horizontal lines extending to the left and right of the horizontal line. The horizontal line extending to the left represents the opening price for a specific period, while the horizontal line extending to the right represents the closing price for that period. Generally, OHLC provides more information than a line chart, which only displays the closing price.
Getting to Know OHLC Strategy
Regarding trading, utilizing the OHLC strategy can be effective and accurate. This strategy is relatively easy and requires little time as a quick observation is sufficient. In trading, the market volume is typically good in the first 15 minutes, increasing the chance of obtaining substantial profits.
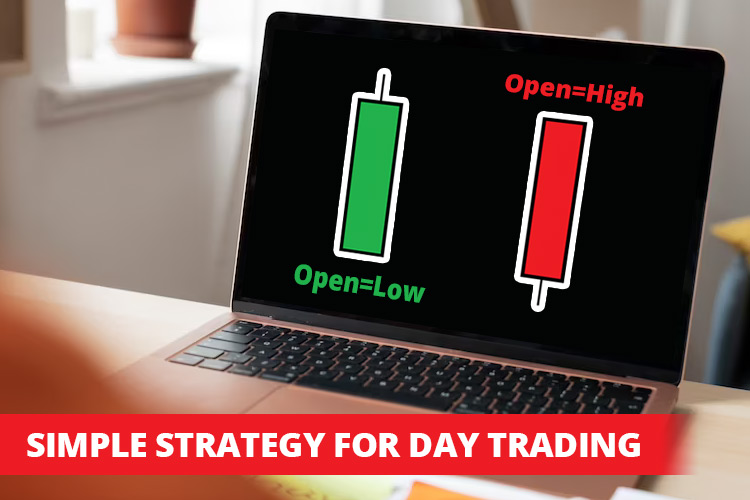
Potential OHLC trading signals occur when the opening price is the same as the highest or lowest price of the day. A buy signal is generated when the price has the same value for both the open and low, while a sell signal occurs when the price has the same value for both the open and high.
Consider the formula below:
Open = Low (buy)
Open = High (sell)
During the opening minutes of the market, you can observe and determine whether there is an OHLC trading opportunity for the day.
Using OHLC Strategy in Day Trading
The OHLC strategy can also be utilized in day trading. Below are some trading examples that can be replicated:
1. Aggressive Day Trading Strategy
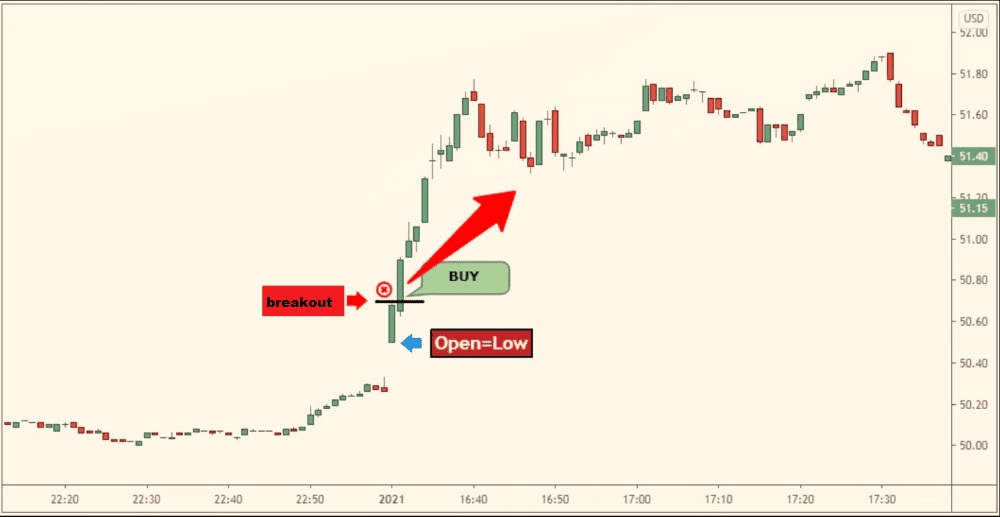
This strategy focuses on the beginning of trading when the candle starts to form. If the opening is equal to the highest point (bearish candle) or the open positions equal to the lowest point (bullish candle), trading with OHLC can be done.
- To sell, wait until the 1-minute candle breaks the low if the opening equals the highest point, and stop above the 1-minute candle.
- To buy, wait until the 1-minute candle breaks the high if the opening equals the lowest point, and stop below the 1-minute candle.
Suppose the price difference is above or below the previous day's close. In that case, traders can choose an alternative approach by waiting for a retracement to the midpoint of the 1-minute candle before executing a trade. This is because OHLC tends to experience pullback patterns, especially if the first candle has a large price range.
The pullback strategy can help improve the Risk and Reward Ratio. You can place a Stop Loss at the previous day's close or above or below the current opening price.
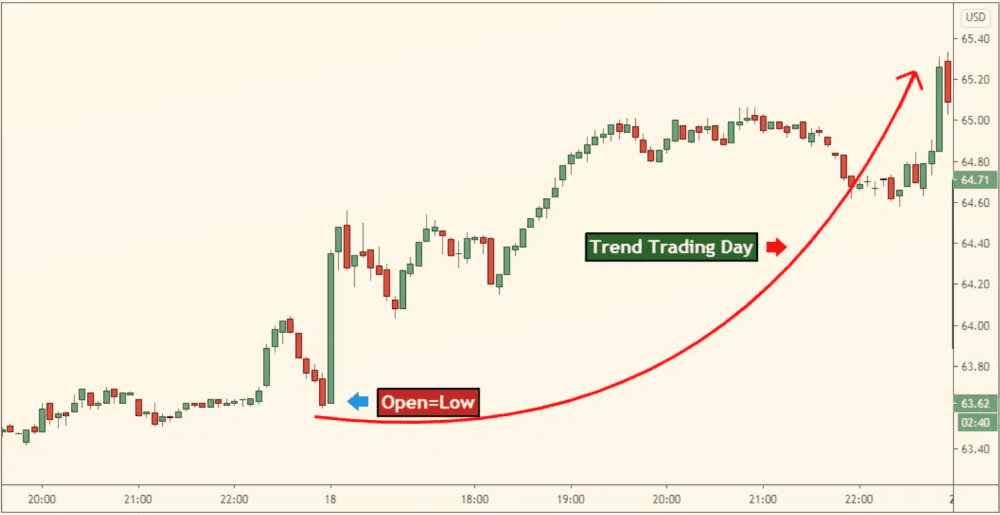
2. Trend Trading Day with OHLC Strategy
If a trader uses the open drive method (when the price opens above or below the previous day's price), it is best to refrain from trading for as long as possible. However, if the opening price is the same as the highest or lowest price, then this can be a good opportunity for the price to develop toward the open drive direction. To clarify, please refer to the chart below:
3. Determining Profit with OHLC
When using OHLC, you can use OHL trading to generate a trend day move or obtain more significant price movements. Use the ATR (Average True Range) indicator to measure how far the price will move.
For example, if an asset has an ATR of $10 and has reached $2 at the opening, there is a potential profit of $8 for the day. Therefore, if a trader knows that a stock has a price range of $10, they can set a profit target of that amount or any amount they consider suitable.
Refer to the chart below:
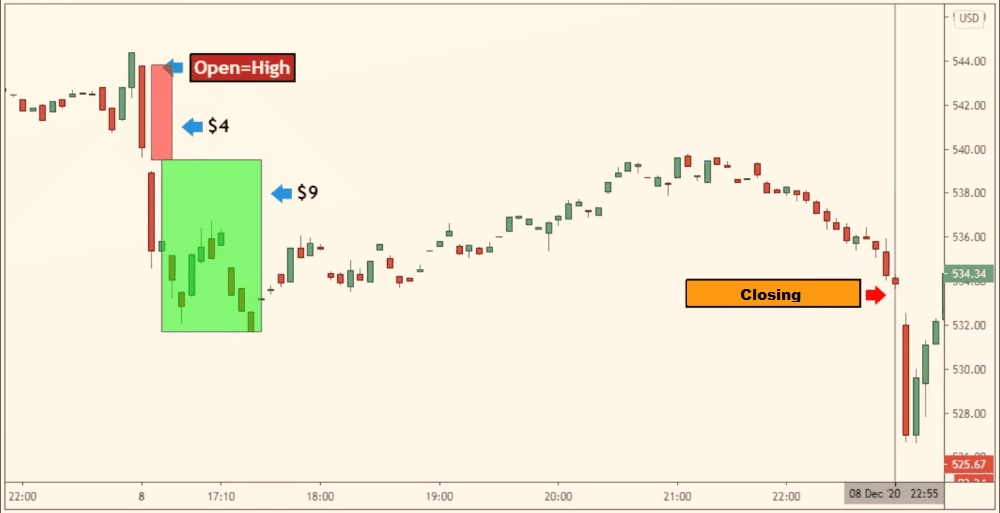
In the above chart, the 1-minute candle widened by more than $4, which presents a potential profit of $11. However, it is also important to note that the stock price only moved within a range of $9, which could be a suitable profit target.
Conclusion
The OHLC strategy can be the key to success, especially in day trading. This strategy is relatively easy and quick to apply, making it suitable for beginner traders. The first step is to pay attention to the opening minutes of the market and the beginning of trading to determine the next steps. Minimizing risks by performing pullbacks and using ATR indicators to help determine profit targets is also important.
The key to successful day trading does not only about the strategy but also about which broker to use. So, which broker has the best conditions for day trading and why?