 Dedicated FREE FOREX VPS
 Free FOREX Virtual Private Server
 MT4 Demo Contest, Get $500
 Sign Up for an Account, Claim 60% Deposit Bonus
 Free MT4/MT5 VPS 2024
 Send E-mail and Get Free Merchandise
 $1K Refer a Friend Bonus for Pepperstone Pro clients
 Maximize Your Earnings with 100% Deposit bonus
 Trade to Win, $5,000 Monthly Demo Contest
 Claim 30% + 15% Deposit Bonus from LiteFinance
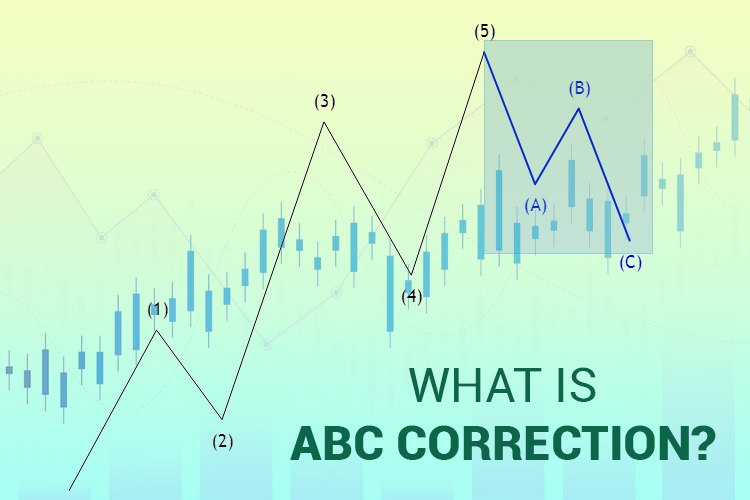
Looking to learn how to trade with ABC correction? This technical concept is a part of trend-following strategy that focuses on pullbacks and corrective waves.
Trading in the financial market is one of the most popular ways to make money and achieve financial freedom. However, with so many instruments like stocks, forex, indices, and others to choose from, it can be challenging to know where to begin. That's where trading strategies come into play, providing traders with a framework for making informed trading decisions.
One such strategy is the ABC correction, which is based on the Elliott Wave Theory, a popular technical analysis tool used to predict price movements in financial markets. The ABC correction can help traders identify market corrections, which are temporary price movements against the overall trend, and potentially profit from them.
Contents
What Is ABC Correction?
The ABC Correction is a continuation pattern that occurs in an uptrend or downtrend and consists of three waves labeled as ABC. This pattern is also known as a flat pattern, and it is part of the larger Elliott Wave theory.
In the Elliott Wave theory, the price action of any financial instrument always moves in corrective and motive waves, with the corrective wave being where we can find the simple ABC. The motive wave is a five-wave pattern, whereas the corrective wave is a three-wave pattern. When applying the Elliott Wave theory, traders can find the simple ABC correction inside the motive wave price movement.
In trading, a bullish correction phase happens when the price moves upwards, pulls back, and then finally continues upwards. The opposite, of course, occurs for a bearish ABC correction pattern. These corrective phases can help traders identify potential continuation points.
If we look at the chart below, in an uptrend, the price falls at point A, rises at point B, and at the preceding impulse wave C, it drops again. When the simple ABC pattern is complete, we can enter a long position.
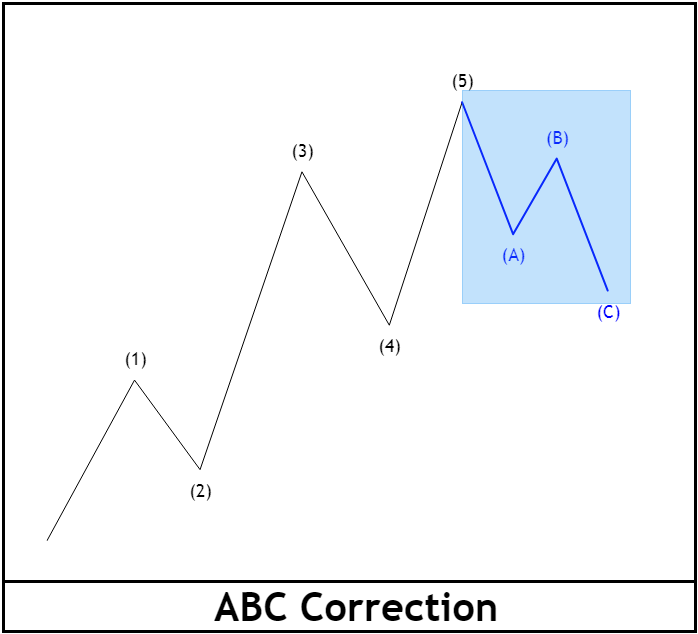
Conversely, in a downtrend, the price would go up at point A, dip at point B, and make another high at point C before continuing downwards. We can enter a short position when the pattern is complete.
It's important to note that there can be a corrective wave within the motive wave. Therefore, we should be aware of the context in which the ABC correction pattern appears. If the pattern appears within a motive wave, then we should be cautious as it may indicate a possible trend reversal. On the other hand, if the pattern appears in a corrective wave, it may suggest a trend continuation.
How to Recognize and Apply the ABC Correction?
Identifying and understanding the ABC Correction is crucial in forex trading. To identify the pattern, here are certain rules that must be followed:
- The price must pull back at least 10% from the high in an uptrend or low in a downtrend. If the pullback is less than 10%, it is not considered a valid pattern. This retracement is known as wave A.
- After the retracement, the second wave, known as wave B, is the smallest of all the waves. This wave usually retraces around 50% of wave A. The B wave usually follows a zigzag pattern, which can be identified by the peaks and troughs on a chart.
- Finally, wave C is the last wave in the pattern, and it must be longer than wave A. Wave C is usually equal to or greater than wave A in terms of price movement. It can sometimes exceed wave A and be longer than expected.
To correctly draw the pattern, we must determine the trend first. This can be done by identifying the higher highs and higher lows in an uptrend or lower highs and lower lows in a downtrend. Once the trend has been established, we can wait for the price to form higher lows or lower highs. This is known as the point of entry or point C. Once point C has been reached, the pattern is complete, and we can enter a trade in the direction of the trend.
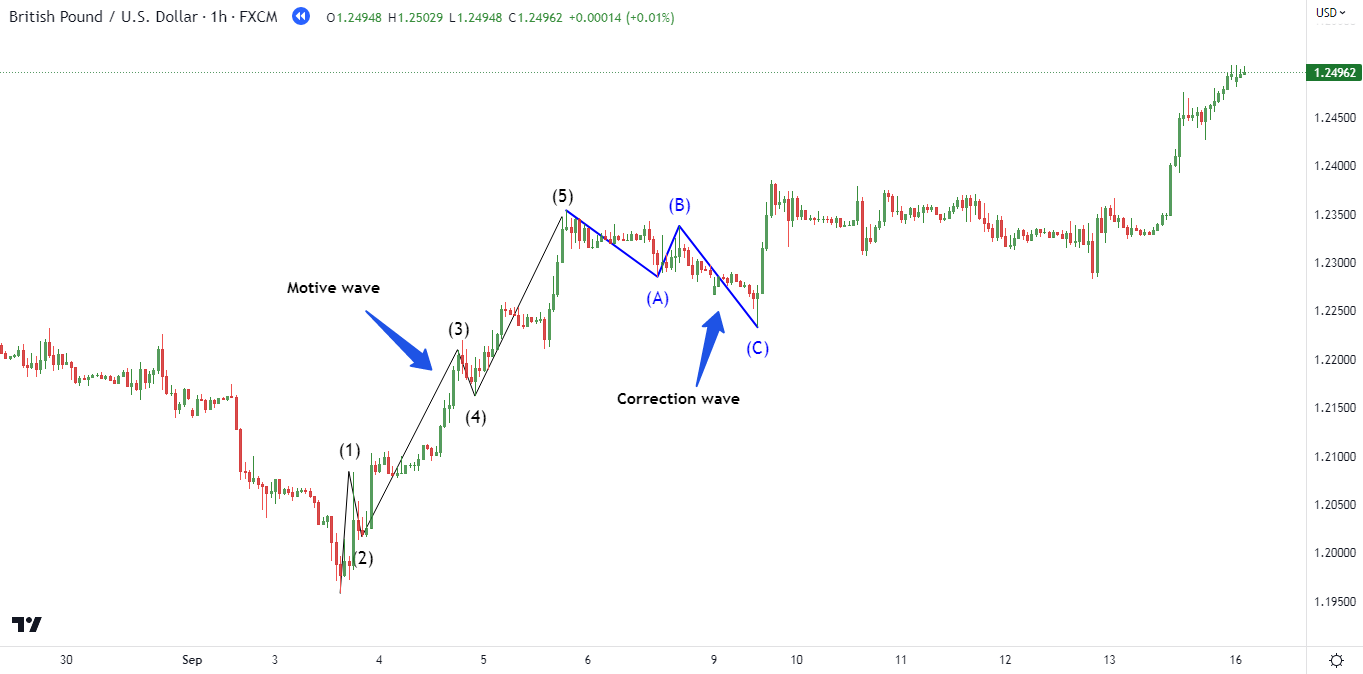
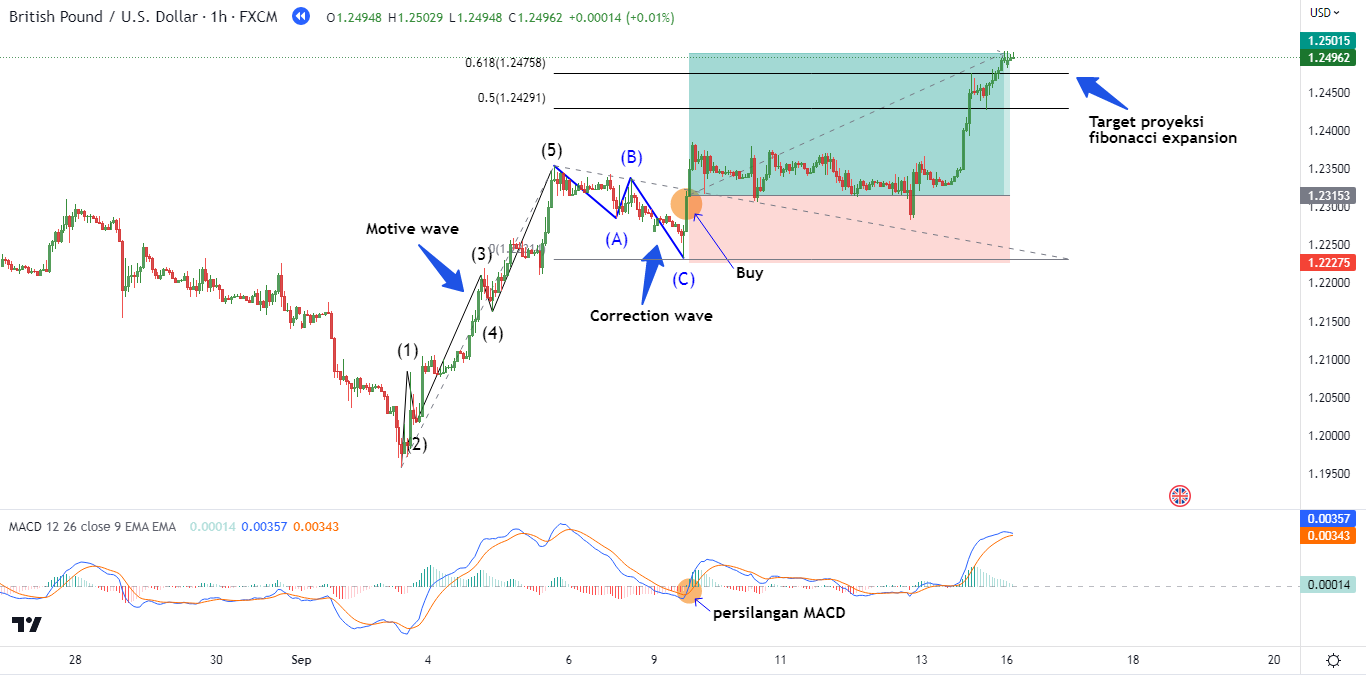
In the case of the GBP/USD chart above, the pattern begins with an upward trend in price, which is then followed by a pullback of over 10%. This pullback creates wave A, which serves as the first stage of the pattern.
After wave A, the price action goes through a higher high, which forms wave B. This is followed by a higher low in wave C, completing the ABC pattern. The completion of this pattern signals a continuation of the trend that was observed in the initial upward movement.
It's worth noting that during the transition from wave B to wave C, the market tends to experience lower trading volume. This decrease in trading activity is a crucial characteristic of a flat correction pattern, which is what the ABC pattern is classified as.
See Also:
Be Mindful of These Points
While the ABC pattern is generally regarded as a reliable trading strategy, it's important to exercise caution when using it as an indicator. It's not a foolproof method for predicting future price movements, and there are always risks involved in trading financial markets.
In summary, these are the instructions you should keep in mind when detecting and executing trades using the straightforward ABC correction pattern:
- Firstly, you must identify the primary impulse move in the market. This refers to the directional movement that occurs as a result of a major market event, such as a significant news release or change in economic conditions. This initial move will set the foundation for the rest of the pattern.
- Once you have identified the initial impulse move, you must look for the price to retrace by 10% from the first price swing to point A. The retracement occurs in either an uptrend or a downtrend and is necessary to confirm the start of the correction. In other words, you are looking for a brief counter-trend movement against the initial impulse move.
- After the retracement, you should be able to see the ABC correction pattern starting to take shape. The AB wave should be shorter than the BC wave, with the BC wave being the longest. This means that the price should move from point A to point B relatively quickly, while the movement from point B to point C should take longer.
- Once you have identified the ABC pattern, you should use another technical analysis tool to confirm the movement. This could be anything from a moving average crossover to a momentum oscillator. By using another tool, you can help to minimize false signals and improve the accuracy of your trades.
- Finally, once you have confirmed the ABC pattern and the direction of the trend, you can enter the trade at point C. This is the point where the price is likely to reverse, so it's important to be ready to execute your trade at this point.
Steps to Trading with ABC Correction
Once you have learned to recognize the simple ABC pattern, the trading strategy typically involves searching for pullbacks instead of breakouts. The goal is to align with the primary trend, and this requires proficiency in using multiple time frames for trading. To trade this pattern, you can follow these steps one by one.
1. Determine the Trend
The first step in identifying a trend is to examine the price charts and look for any patterns or movements that indicate an upward or downward trend. It is important to note that trends can occur in different time frames, ranging from minutes to months, and we must choose the appropriate time frame based on their trading goals.
One way to identify the trend is to draw a trend line. A trend line is a straight line that connects two or more price points and represents the general direction of the market. If the trend line is sloping upwards, it indicates an uptrend, and if it is sloping downwards, it indicates a downtrend.
Another tool that can be used to identify the trend is moving averages. A moving average is a calculation that smoothes out the price action of an asset over a certain period of time. Traders often use the 50-day and 200-day moving averages to identify the primary trend in the market. If the asset price is above the moving average, it indicates an uptrend, and if it is below, it indicates a downtrend.
It is important to note that longer time frames often provide a clearer picture of the primary trend in the market. Therefore, we should switch to longer time frames, such as daily or weekly charts, to identify the main trend and determine the trading strategy accordingly.
2. Draw ABC Correction
Once we identify the trend, we can proceed to draw the ABC points. The first step is to ensure that the price has pulled back at least 10% from the high in an uptrend or from the low in a downtrend. This ensures that the pullback is significant enough to indicate a potential trend reversal.
After the pullback has occurred, the price should then move in the direction of the trend, creating a point B, which is the shortest wave in the pattern. It is essential to note that point B should not exceed 61.8% of the previous wave. This ensures that the corrective wave pattern remains intact and is not invalidated.
The next step is to locate point C, which is the longest of all the waves in the pattern. Point C should not move beyond the starting point of wave A, as this would indicate a potential trend reversal. We can use various tools such as Fibonacci retracements, trend lines, or other technical indicators to locate point C accurately.
3. Confirm the ABC Correction
Step 3 is all about waiting for the completion of the ABC correction pattern. Once the pattern is complete, it is essential to wait for a signal indicating that the trend will continue before entering a trade. This is where technical indicators come into play.
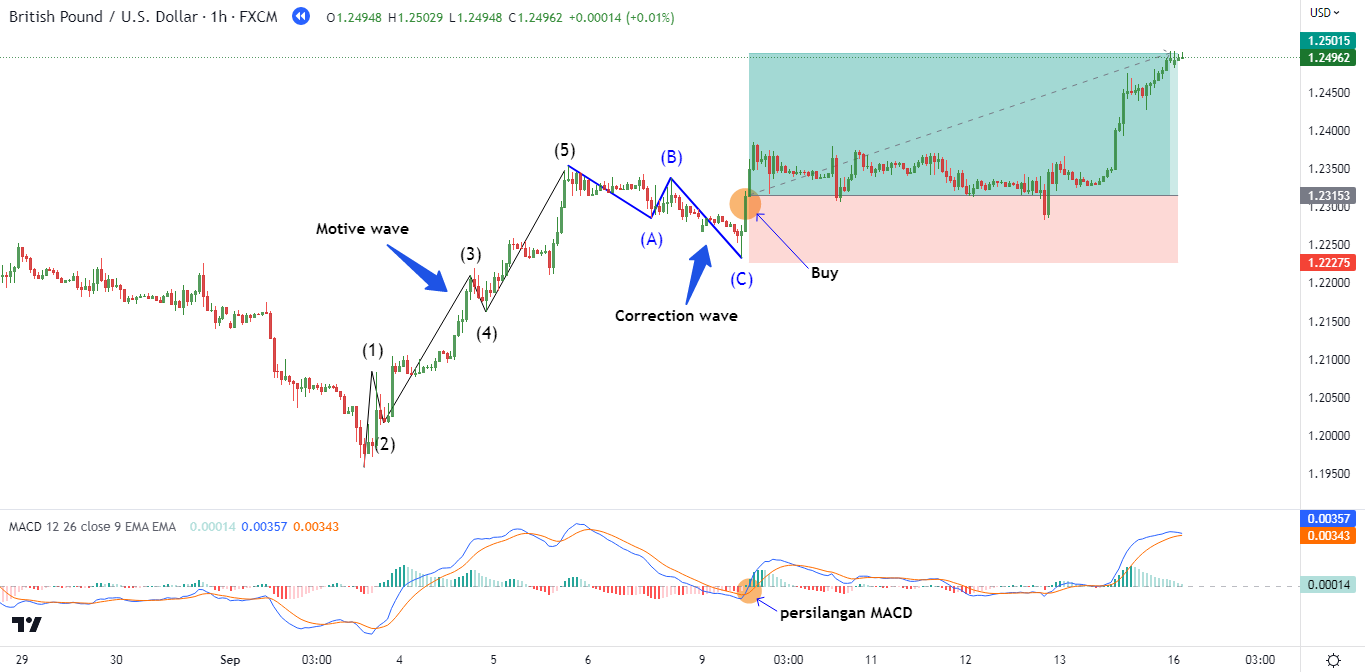
In the ABC correction pattern below, after wave C, the price may rise above the moving average line, providing another signal for an entry point. This indicates that the trend may continue in the same direction as the first price swing. Therefore, entering a trade at point C can be a good idea.
There are two ways to enter a trade when using the ABC correction pattern:
- Enter a trade immediately at point C, provided that another signal indicates the price is likely to continue in the same direction as the first swing. This could be an overbought/oversold reading on the RSI, a MACD/stoch crossover, or a retracement to a Fibonacci level.
- Wait for the price to surpass the highest level of the first upswing, which is a more cautious approach. This strategy suggests that once the price rises above this level, it could potentially continue trading in the same direction. Therefore, it is a relatively conservative strategy to trade.
4. Set Stop Loss and Take Profit Levels
One of the main advantages of the ABC correction pattern is that it allows us to enter a trade with a tight stop loss, which can help to minimize potential losses in case the trade goes against us.
For instance, if we decide to enter the trade at point C, which is where the price retraces back to after a downtrend, we can set the stop loss at the lowest level of the first price swing. This will provide a clear exit point in case the price falls below the swing low, allowing us to limit losses and preserve our capital.
On the other hand, if we enter the trade at the continuation of an uptrend, we can set the stop loss at point C, which is where the price retraces back to before continuing the uptrend. By doing so, we can again limit the downside risk and ensure that we won't be caught off guard by any sudden market movements.
In either case, the basic ABC pattern can help us to enter the trade with a favorable risk-reward ratio. This means that the potential reward from the trade is greater than the potential risk, making it a worthwhile trade to take. This is particularly true if there is a strong move following point C, which can indicate that the price is likely to continue in the same direction for some time.
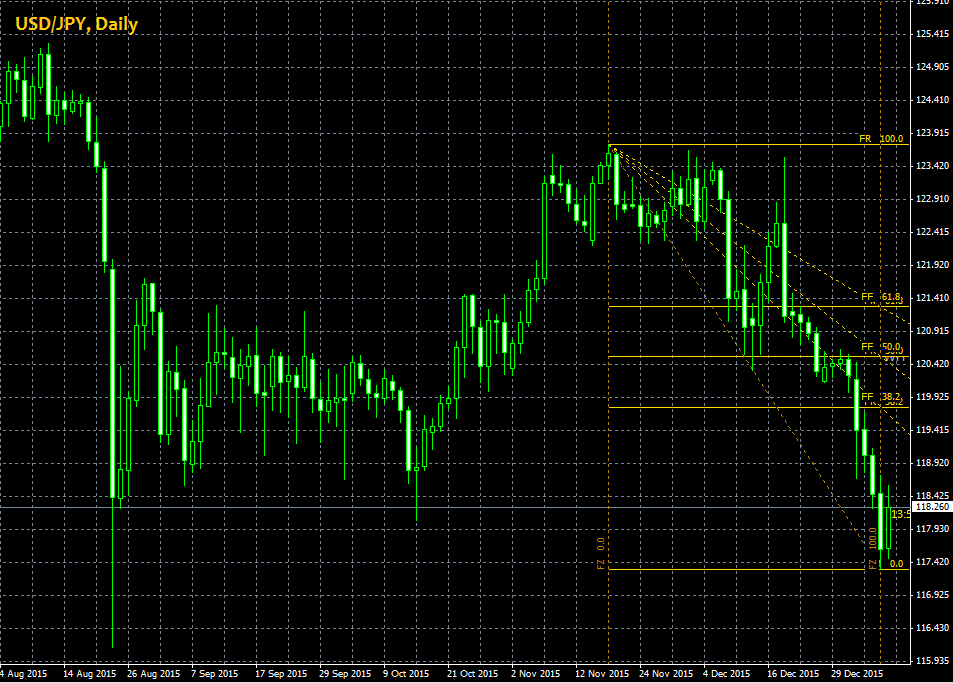
When it comes to setting the take profit level, one strategy is to use the Fibonacci levels. These levels are based on the Fibonacci sequence, which is a mathematical sequence that appears in many natural phenomena, including financial markets. By setting the take profit level at one of Fibonacci levels above the entry level, we can potentially capture a significant portion of the price move and maximize profits.
Advantages and Disadvantages of ABC Correction
The simple ABC correction pattern can be a powerful tool, but it is important to be aware of both its advantages and disadvantages. Here are some of the key pros and cons of using this pattern:
Pros
- The simple ABC pattern is a versatile trading concept that can be applied to a wide range of markets and time frames. This means that we can potentially use this pattern to find trading opportunities across different assets, such as stocks, currencies, and commodities, as well as different time frames such as daily, weekly, or monthly charts.
- The pattern provides precise entry and exit points. By identifying the A, B, and C points of the pattern, we can establish clear levels for entering and exiting trades, which can help to reduce ambiguity and improve trading accuracy.
- The pattern often leads to long price movements following point C. Once the pattern completes, the price tends to move in the direction of the initial trend, potentially providing significant profit opportunities.
- The pattern allows for setting tight stop loss orders, which can help to minimize risk and provide an attractive risk-reward ratio. By placing stop loss orders close to the entry point, we can limit potential losses while still having the potential to make a large profit if the trade moves in our favor.
Cons
- The simple ABC pattern is part of the broader Elliott Wave theory, which can be quite complex for beginner traders. Understanding the underlying theory behind the pattern and how to identify the different wave counts and degree levels may require a significant amount of study and practice.
- The pattern is less suited for shorter time frames, particularly for scalping and day trading strategies. Due to the complexity of the pattern and the need to wait for multiple price swings to complete, it may be difficult to use this pattern for short-term traders.
Frequently Asked Questions on ABC Correction
- What is the 5-3 corrective wave pattern?
As per the Elliot principle, there are five types of corrective patterns, namely impulse (5-3-5-3-5), diagonal, zigzag (ABC), flat (3-3-5), and triangle (3-3-3-3). The 5-3-5 corrective wave pattern refers to a single zigzag pattern and indicates that within the corrective ABC, there is a motive wave comprising of waves 1, 2, 3, 4, and 5. In accordance with the 5-3 corrective wave pattern, 5-wave trends are corrected by 3-wave countertrends. If this occurs, it is likely that the trend will continue in the direction of the previous trend. - What occurs following the completion of the ABC corrective wave pattern?
It's probable that the price will continue to move in the direction of the initial price swing that preceded the ABC correction pattern. - What distinguishes the ABC corrective wave pattern from the WXY corrective wave pattern?
ABC and WXY are two types of corrective Elliott Waves. ABC has a 5-3-5 structure, whereas WXY has a 3-3-3 structure, which includes an ABC corrective wave. Moreover, WXY commonly appears in a sideways market movement, whereas ABC typically forms during a trend. - Is the ABC correction pattern reliable for making trading decisions?
Like any other technical analysis tool, it is not 100% reliable, and we should exercise caution when using it to make trading decisions. While the ABC correction pattern can be a valuable addition to our trading toolkits, it should not be used in isolation when making trading decisions. We should combine it with other technical tools and fundamental analysis to improve its effectiveness and reduce the risk of false signals. Additionally, we should carefully assess market conditions and use proper risk management when executing trades based on this pattern. - How long does an ABC correction pattern usually last on a price chart?
The duration of an ABC correction pattern on a price chart can vary widely depending on the specific market conditions and the time frame being analyzed. In general, the correction (B wave) of the ABC pattern tends to last longer than the initial move (A wave) and the final move (C wave). The length of time for the correction (B wave) can be influenced by various factors, such as market volatility, trading volume, and the strength of the overall trend. It is not uncommon for the correction to last anywhere from a few days to several weeks or even months in more complex patterns.
ABC correction pattern can develop into various types of patterns that don't only lead to trend continuation but also reversals. All of them are generally defined by Fibonacci levels, and that's why such patterns are also recognized as Fibonacci patterns.


11 Comments
Ashley
May 1 2023
As a beginner trader, I understand now that the simple ABC pattern is a fundamental component of the broader Elliott Wave theory. However, I've come to realize that grasping the intricacies of this theory can be quite complex. Could you provide some insightful tips and techniques that would help me better comprehend the underlying theory behind the ABC pattern? I'm particularly interested in learning how to identify the different wave counts and degree levels, but I'm aware that this might require a significant amount of study and practice. So, what resources, strategies, or approaches would you recommend for a beginner like me to gain a solid understanding of the ABC pattern and its broader context within the Elliott Wave theory? Thank you!
Tanto
Jun 4 2023
@Ashley: Hey there! In my opinion, to understand ABCD pattern and Elliot Wave you can follow this steps:
Dive into Learning: Start by reading books like "Elliott Wave Principle" by Robert Prechter and A.J. Frost or "Mastering Elliott Wave" by Glenn Neely.
Break it Down: The ABC pattern has three waves: A, B, and C. Think of them like puzzle pieces that fit together to form larger patterns
Understand Wave Counts: Wave counts are the labels given to waves in Elliott Wave Theory. They help you identify and track the waves.
Get Charting Software: Use charting software that includes Elliott Wave analysis tools.
Analyze Past Charts: Look at historical price charts and try to identify the ABC pattern in hindsight. .
Connect with Fellow Traders: Join online communities and forums dedicated to Elliott Wave Theory.
Practice and Verify: Keep practicing by identifying the ABC pattern on different charts and timeframes.
Remember, Elliott Wave Theory allows for some subjectivity, so develop your own understanding and approach through consistent learning and practice.
Lastly, be patient with yourself. Mastering the Elliott Wave Theory takes time and experience. Set small goals, and as you gain confidence, gradually expand your knowledge and application of the theory.
Lucky Su
May 3 2023
I'm a beginner, and I find it challenging to determine the ABC Pattern. After reading an article, I discovered that the second crucial step in identifying the pattern is drawing the ABC Correction. While I can understand the trend to some extent and use tools to help, drawing the ABC Correction lines requires skill.
According to the article, to draw the pattern, the first thing to do is identify a price pullback of at least 10%. Then, the B line, representing the shortest wave in the pattern, must not exceed 61.8% of the previous wave.
My question is, how can we accurately determine the required percentage to draw the ABC Correction line? Is there a specific method or calculation to follow? I'm curious to learn more about the process of determining the precise percentage and how it helps in drawing the ABC Correction lines
Henry
May 21 2023
@Lucky Su: I can help you with that! Off course, you need to follow every step in the article too! As a beginner, determining the precise percentage for drawing the ABC Correction line can be challenging. However, you can use the Fibonacci retracement tool to help with this.
The 61.8% level mentioned in the article is derived from the Fibonacci sequence and serves as a guideline. It suggests that the B line, representing the corrective wave, should not exceed 61.8% of the previous wave's length. This helps identify potential reversals or different patterns.
To accurately determine the required percentage, use the Fibonacci retracement tool on your charting platform. Mark the start and end points of the previous wave, and the tool will calculate the retracement levels for you.
Remember, Fibonacci retracement levels aren't foolproof, so it's important to use them in conjunction with other tools and indicators. Practice, learn from experienced traders, and gradually improve your pattern-spotting skills. Happy charting!
aslantrader8899
May 25 2023
Is it viable to utilize the ABCD pattern in long-term trading strategies? I mean trading in the financial market offers various opportunities to generate income and attain financial independence. However, with the abundance of instruments available, such as stocks, forex, and indices, it can be overwhelming to determine the starting point. This is where trading strategies play a crucial role by providing traders with a systematic framework to make well-informed trading decisions.
One such strategy is the ABC correction, which derives from the widely-used Elliott Wave Theory—a popular tool for technical analysis aimed at predicting price movements. The ABC correction assists traders in identifying market corrections, which refer to temporary price movements that counter the prevailing trend, potentially enabling traders to capitalize on these shifts.
Now, here's the question: Can the ABCD pattern be effectively employed in long-term trading strategies?
Koji
May 28 2023
@aslantrader8899: Yes, the ABCD pattern can be effectively employed in long-term trading strategies. The ABCD pattern is a popular chart pattern used by traders to identify potential price reversals and continuation patterns. It consists of four price swings, labeled as A, B, C, and D, and is formed by specific Fibonacci ratios between these swings.
While the ABCD pattern is often associated with shorter timeframes and day trading, it can also be applied to longer-term trading strategies. Traders who focus on long-term trends and investment horizons can use the ABCD pattern as a tool to identify key levels of support and resistance and make informed trading decisions.
In long-term trading, the ABCD pattern can help traders identify areas of potential trend reversals or trend continuation. By combining the pattern with other technical indicators and fundamental analysis, traders can increase the probability of making successful trades over the long term.
It's important to note that, in long-term trading, the time horizon for the completion of the pattern may be longer compared to shorter timeframes. Traders should consider the overall market conditions, volatility, and the timeframe they are trading to adapt the ABCD pattern to their long-term strategy effectively.
Enzo
Jun 9 2023
The article mentioned the Elliott Wave theory and its connection to the simple ABC pattern, which can be quite confusing yet fascinating for traders. The theory suggests that financial markets move in repetitive patterns influenced by market participants' psychology. The simple ABC pattern is one of the fundamental patterns within this theory.
Can you shed light on the comprehensive explanation of the Elliott Wave theory and its relationship to the simple ABC pattern? How does the theory encompass the broader concept of wave counts and degree levels, and why is it essential for traders to understand these aspects?
Slavia Shawn
Jul 18 2023
If you want to get the maximum profit in trading, traders must also master trading strategies. One of the commonly used trading strategies is the ABC correction strategy which is based on the Elliott Wave theory. This strategy helps in predicting price movements in trading instruments.
This strategy is also a technical analysis that is used to predict the direction of trend movement by observing market cycles in the form of waves. This wave is the result of the reaction of market participants and reflects the psychology of the market at that time. However, usually, every trend will also experience a decline, so the question is how to identify the end of a correction and continue the trend when using this ABC correction. please explain
Macieja
Jul 19 2023
With the end of a correction, trend continuation momentum will occur with the possibility that the trend will continue in the same direction as before the correction occurred. The 3 ways are:
1. The price breaks the corrective high level for an uptrend or a corrective low for a downtrend. Traders can enter sell when wave B ends, and enter buy when level B is penetrated (break). Traders can enter buy above the corrective high level after the price actually breaks level B.
2. The price breaks the upper corrective channel (upper channel line) for an uptrend or breaks the lower corrective channel (lower channel line) for a downtrend. Repeated corrections will tend to form a channel, either in an uptrend or downtrend. The end of the correction is marked by a break of the channel line in accordance with the direction of the trend before the correction occurred.
3. The RSI indicator breaks in the direction of the trend before the correction occurred. In this case, the identification of a breakout does not have to use the ABC correction wave analysis, but is based on the movement pattern of the RSI indicator which moves in the direction of the price movement trend, and then breaks in the opposite direction.
Billie Anna
Jul 24 2023
False Breakout Trading Strategy In order not to lose because when the market is running, a trader can buy stocks or crypto whose prices penetrate the resistance area or buy on breakouts. However, it is not uncommon for price movements to experience a reversal, aka a false breakout. When do false breakouts occur? Then, how to minimize the occurrence of false breakouts? thank you bro
Adelajda
Jul 25 2023
False breakouts can happen at any time, usually when important fundamental news is released. Market sentiment such as macro news releases related to issuers, company acquisitions that are considered profitable, large dividend payouts, projected company performance in the future, and other positive fundamental sentiments can usually trigger a false breakout in prices.
During the course of the market, the above stocks were still in full candle condition and were able to stay above resistance supported by a significant increase in volume. Unfortunately, For Indonesian Traders, after the release of survey data for Indonesian residential property prices for quarter 3-2021 on the same day, November 12, 2021, which reported that residential property prices had limited growth, causing stock prices to move lower and even fall from the resistance area and return to the sideways area.