Let's Learn Candlestick!
What Is Candlestick Pattern?
Candlestick pattern is formed by the arrangement of one or more candlesticks on a chart. A single candlestick typically represents the price movement for a specific time period, and it consists of four main components: open, close, high, and low. The body of the candlestick is formed by the open and close prices, and the " wicks" or "shadows" represent the high and low prices during the time period.

Why Should We Understand Candlestick Analysis?
- To recognize market patterns: Candlesticks provide a systematic way to spot recurring market scenarios. Traders who can identify and interpret these patterns quickly are better equipped to react to changing market conditions.
- To identify market sentiment: Different patterns convey whether the market is bullish, bearish, or indecisive. Show More
- To time entries and exits: For example, certain patterns may suggest an opportune moment to open a buy trade or close a sell trade on a bullish reversal. On the contrary, bearish reversal patterns could tell the right time for traders to enter a sell position or exit a buy position.
- To understand price action: Candlestick patterns provide a visual representation of price action during a specific time period. Traders and investors can quickly assess whether buyers or sellers dominate the market.
- To spot trend reversal: Recognizing candlestick patterns can help traders identify points where a prevailing trend might be losing strength or reversing.
- To confirm other technical readings: Candlestick analysis is often used in conjunction with other technical analysis tools and indicators, such as moving averages or trendlines.
- To help with risk management: Traders can use candle wicks to place stop-loss or take profit orders to manage their risk exposure.
- To enhance educational value: Learning candlestick analysis can be an educational journey that deepens one's understanding of market dynamics. It introduces traders to technical analysis concepts and helps them develop a more comprehensive trading strategy.
How to Use Candlestick as an Effective Tool for Making Decisions?
Candlestick charts are widely used in technical analysis to make trading decisions. Here are some steps on how to use candlesticks effectively for decision-making in trading: Show More
- Understand candlestick patterns and identify them on the chart.
- Combine with other technical indicators.
- Wait for trend reversals.
- Confirm with volume analysis
- Consider timeframes
If you use the candlesticks along with resistance and support lines, you will never get lost - and never guess your way around. Simply pay attention to sentiment shifts that are reflected by the candlesticks formations that occur or coincide with significant support or resistance lines – particularly those that pop up – in the level of historical highs or lows. With a great degree of accuracy, the market is likely to either 'hiccup' or take a big leap forward from that point.
In fact, there is no better tool to use to formulate a profitable swing trade strategy except with candlesticks along with resistance and support lines.
Continue Reading at Swing Trading, The Ideal Trading Strategy For Retail Forex Traders
Moving Average is one of the simplest technical indicators. It is a straightforward yet powerful tool that can be used to analyze the price movement along with candlestick patterns.
While candlestick patterns put more emphasis on the short-term buy/sell balance, moving averages can contribute by giving a bigger picture or the trend context. Using candlestick patterns and moving averages therefore can help you confirm the trend and make a better prediction.
Continue Reading at A Useful Guide to Combine Candlesticks with Indicators
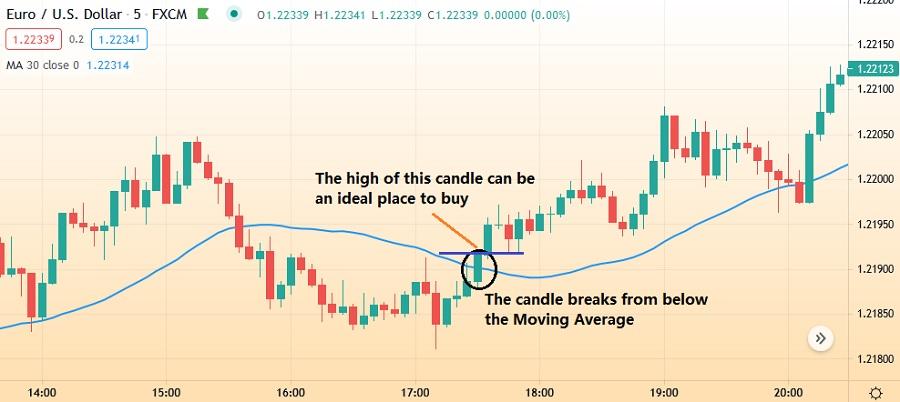
- Use 30 SMA on a 15-minute chart.
- See if there's a bullish candlestick that appears after a downtrend/range market.
- See if the candlestick breaks through the Moving Average from below.
- Place a buy entry at the High the moment it breaks through the Moving Average.
Continue Reading at A Useful Guide to Combine Candlesticks with Indicators
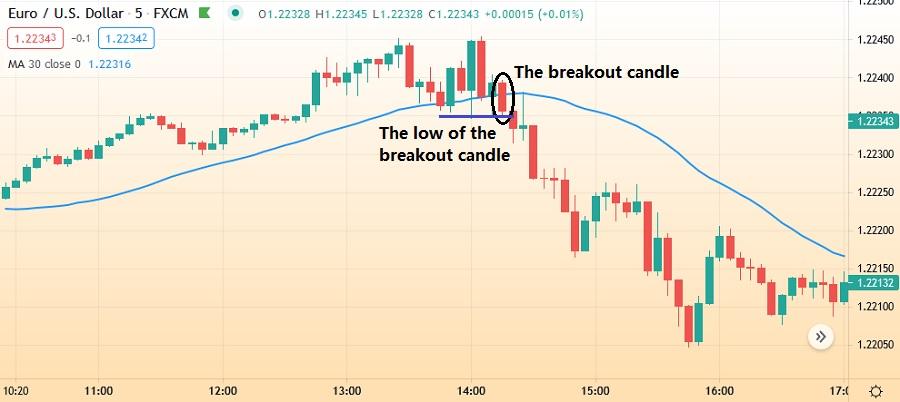
- Set 30 SMA on a 15-minute chart.
- See if there's a bearish candlestick appears after an uptrend/range market.
- See if the candlestick breaks through the Moving Average from above.
- Place a sell entry at the low of the price the moment it breaks through the Moving Average.
Continue Reading at A Useful Guide to Combine Candlesticks with Indicators
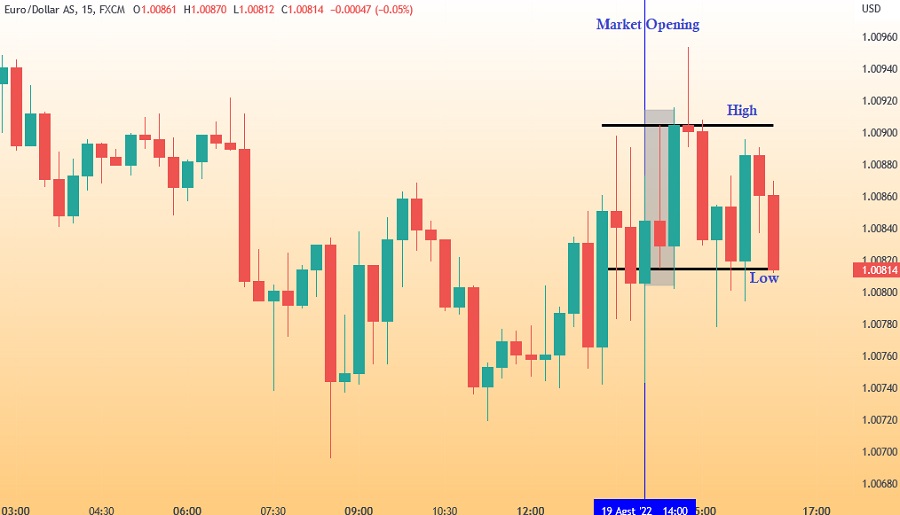
- Once the first 15-minute candle closes, two lines should be marked on the high and low of the candle.
- Switch the chart to a 5-minute time frame.
- Wait for 3 candles to be formed on the 5-minute chart. When the 4th candle breaks any of the two lines drawn initially (whether upper or lower) and then closes outside of them, this is the point where you enter the trade.
Continue Reading at 15-Minute Candlestick Trading Strategy
Candlestick Patterns for Beginner Traders
Beginners should start with single and double candlestick patterns as they are easy to recognize and appear frequently on the chart. Most of them are also crucial enough to indicate major price changes. Show More
Single candlestick patterns are price formations with only one candlestick. The characteristics of each pattern are identified by the size of body and wicks as well as their position in the price movement.
- Hammer: Long lower wick, small body at the top, and minimal upper shadow.
- Inverted Hammer: Long upper wick, small body at the bottom, and minimal lower shadow. Suggests buying pressure emerging after a downtrend, hinting at a potential reversal.
- Hanging Man: Similar to a hammer, but with a long upper wick instead of a lower wick.
- Shooting Star: Similar to an inverted hammer, but with a long lower wick instead of an upper wick.
- Doji: Cross-shaped candlestick with almost non-existent body and long wicks on both sides or just one side.
- Pin Bar: Characterized by a long wick on either the top or bottom of the candle, with a relatively small body. It's almost similar to Doji, only with a sligthly bigger body.
- Marubozu: Large, filled-in body with either minimal to no upper or lower wicks.
- Inside Bar: Small candle, with its entire body and wicks falling within the high and low range of the previous candle.
Double candlestick patterns are formations in technical analysis that consist of two consecutive candlesticks. They are determined by the size of the candlestick elements (body and wicks), their bearish/bullish signature, as well as their position in the price movement.
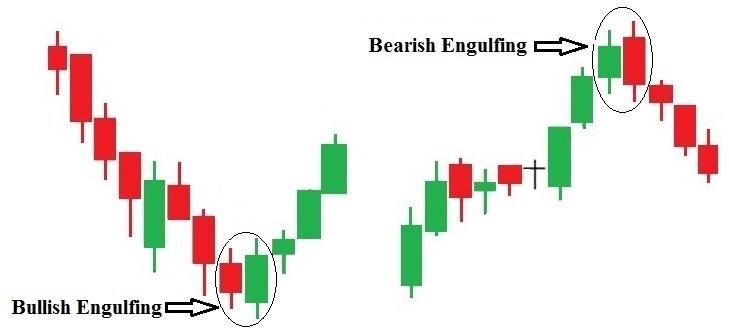
- Bullish Engulfing: Occurs during a downtrend. The first candle is a bearish candle, followed by a larger bullish candle that completely engulfs the previous one.
- Bearish Engulfing: The opposite of the bullish engulfing, so it forms in an uptrend, with the first candle being bullish and the second, larger candle being bearish.
- Bullish Harami: The first one is a large bearish candle, followed by a smaller bullish candle that is entirely within the range of the previous candle.
- Bearish Harami: As the opposite of the bullish harami, it occurs in an uptrend, with the first candle being bullish and the second, smaller candle being bearish and completely within the range of the previous one.
- Piercing Line: Forms after a downtrend., it consists of a bearish candle followed by a bullish candle that opens lower but closes more than halfway into the body of the first candle.
- Dark Cloud Cover: The bearish counterpart to the Piercing Line, it occurs after an uptrend and consists of a bullish candle followed by a bearish candle that opens higher but closes more than halfway into the body of the first candle.
- Tweezer Tops and Bottoms: Involve two candles with equal highs or lows. In a tweezer top, the first candle is bullish, and the second is bearish, while the tweezer bottom is the opposite.
Most novice traders make their mistakes when they treat a single candlestick pattern as a trading signal. It is essential to understand that candlestick patterns have little value if we don't see them in the right price action context. Patterns alone usually don't have enough power to reverse the trend of the market.
Continue Reading at A Useful Guide to Combine Candlesticks with Indicators
There are at least three H4 trading strategies with the Doji candlestick:
- Morning Doji Star: a bullish reversal pattern consisting of one bearish candle (1st), followed by a Doji candle (2nd), and one bullish candle (3rd). The body of the Doji should be below both the first and second candles.
- Evening Doji Star: a bearish reversal pattern consisting of one bullish candle (1st), followed by a doji candle (2nd), and one bearish candle (3rd). The body of the Doji should be above both the first and second candles.
- Doji Sandwich: a trend continuation pattern that can appear during both a downtrend and an uptrend. During a market downtrend, Doji Sandwich will show up as three candles in which the first bearish candle (1st) is followed by a Doji candle (2nd) and a second bearish candle (3rd). The condition in an uptrend is basically the opposite.
Continue Reading at H4 Trading Strategy with Doji Candlestick
Yes, it is. It has long been tried in the market, so its accuracy is fairly high. However, we also have to maintain strict money management and other risk-control measures. There's no 100% perfect setup, including this H4 trading strategy.
Continue Reading at H4 Trading Strategy with Doji Candlestick
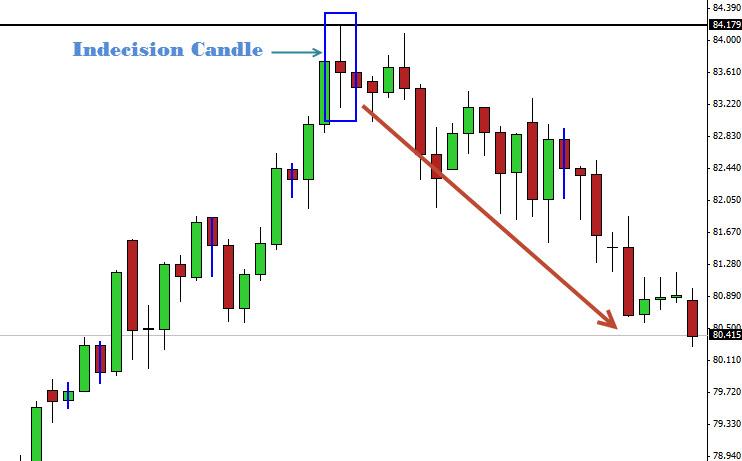
Commonly known as the spinning top pattern, it consists of a tiny body with long tails. The pattern shows indecision because there is volatility throughout the period, but by the end of the time, the price is near where it started.
While spinning tops may occur on their own and signal a trend reversal, sometimes there are two or three that occur together. The price will then make a drastic move in one direction or the other, and close in that direction as well. That is the direction to trade in.
Continue Reading at A Useful Guide to Combine Candlesticks with Indicators
A bullish candlestick pattern always appears in a downtrend. It is characterized by the price moving lower, typically shown via red or black candles. Then after that, there's a large candle often colored green or white, which is larger than the previous bearish candle.
The same concept goes to the bearish engulfing pattern but in the opposite way. The price should be going up and then there's a large down candle that envelops the last up candle. This means that the sellers are entering the market aggressively.
Continue Reading at A Useful Guide to Combine Candlesticks with Indicators
Candlestick Patterns for Intermediate Traders
The next step in candlestick education should be learning triple candlestick patterns. The formations are not quite easy to recognize as they involve three candlestick pieces, each with different characteristics in size and bearish/bullish signature. Show More
Compared to single and double patterns, triple candlestick patterns are harder to find on the chart as there needs a high level of confirmation to ensure that all three candles suit the criteria of a valid pattern. This leads to triple candlestick patterns having the highest accuracy among other formations.
- Morning Star: Typically occurs at the bottom of a downtrend. It consists of a long bearish candle, followed by a small candle (the star), and then a long bullish candle.
- Evening Star: The bearish counterpart to the Morning Star, it occurs at the top of an uptrend, consists of a long bullish candle, a small candle, and then a long bearish candle.
- Three White Soldiers: Occurs after a downtrend, it consists of three consecutive long bullish candles with each opening higher than the previous one.
- Three Black Crows: The bearish counterpart to the Three White Soldiers, it occurs after an uptrend and consists of three consecutive long bearish candles, each opening lower than the previous one.
- Three Inside Up: It involves a long bearish candle, followed by a smaller bullish candle that is completely within the range of the previous one, and then another bullish candle that closes above the high of the first candle.
- Three Inside Down: The bearish counterpart to the Three Inside Up, it occurs after an uptrend and involves a long bullish candle, followed by a smaller bearish candle within the range of the previous one, and then another bearish candle that closes below the low of the first one.
Candlestick Patterns for Advanced Traders
Combining candlestick patterns with technical indicators is a common practice in technical analysis to enhance the accuracy of trading signals and gain a more comprehensive view of market conditions. It can involve all types of candlestick patterns, whether single, double, or triple candlestick patterns. The key is, the more patterns to consider, the more accurate the trading signal. Show More
There are 8 ways to combine candlestick patterns with tehcnical indicators:
- Identify trend direction with trend-following indicators like Moving Averages or trendlines to check the overall direction of the market.
- Confirm reversal patterns with indicators. When spotting reversal candlestick patterns like Engulfing patterns or Hammers, use momentum indicators to confirm the potential reversal. Look for divergence between the indicator and price action.
- Use support and resistance levels on your charts along with candlestick patterns. These levels can act as additional confirmation for potential breakouts or reversals.
- Combine patterns with oscillators. For example, when a Doji or Hammer appears near oversold conditions on the RSI, it may strengthen the potential for a bullish reversal.
- Pay attention to trading volume when identifying candlestick patterns. A surge in volume accompanying a reversal candlestick pattern adds validity to the signal.
- Combine candlestick patterns with crossover signals. For instance, when a bullish engulfing pattern occurs near a bullish Moving Average crossover, it can add weight to the potential upward move.
- Integrate Fibonacci retracement levels with candlestick patterns to identify potential reversal zones. If a Doji or other reversal pattern appears near a significant Fibonacci level, it may enhance the signal's reliability.
- Utilize indicators that measure trend strength, such as the Average Directional Index (ADX). When a candlestick pattern appears, the ADX can help you assess whether the trend is strong enough to support the potential reversal.
While candlestick patterns put more emphasis on the short-term buy/sell balance, moving averages can contribute by giving a bigger picture or the trend context. Moving averages will move along with the prices as new bars appear. So when the price hits a higher price, the moving average will move up too. The same goes when the price goes down to a lower price, in which the moving average will move down accordingly.
Using candlestick patterns and moving averages therefore can help you confirm the trend and make a better prediction.
Continue Reading at A Useful Guide to Combine Candlesticks with Indicators
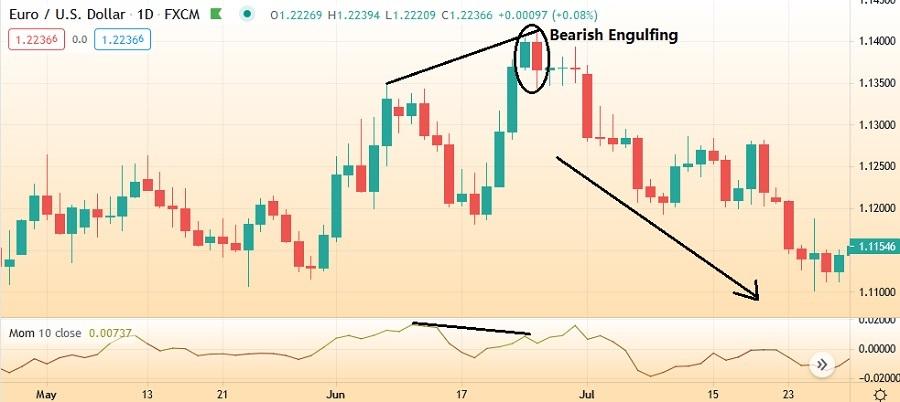
The following chart shows a strong divergence because while the price is moving upward and forming highs, the momentum indicator is dropping. Just after setting a new high, the price created a strong bearish engulfing pattern and the price starts moving downward.
Continue Reading at A Useful Guide to Combine Candlesticks with Indicators
Try to observe the behavior of the candlestick patterns at the point of RSI divergence. In a reversal from a downtrend, we would want to look for bullish patterns such as a bullish hammer or dragonfly doji. In a reversal from an uptrend, we should look for bearish patterns like bearish engulfing or gravestone doji. Also, keep in mind that the price must close above the previous candlestick price.
Continue Reading at Bollinger Bands and RSI Combo Strategy
In this case, the candlestick chart takes the role of "trading indicator" by itself. To emulate them, you'll need to equip yourselves with all the necessary knowledge related to candlesticks. It is also crucial to understand the basics of popular one-candle, two-candle, and three-candle patterns, including but not limited to Doji, Hammer, Shooting Star, Three Black Crows, and Morning/Evening Star.
Continue Reading at Which Indicator is Best for Scalping?
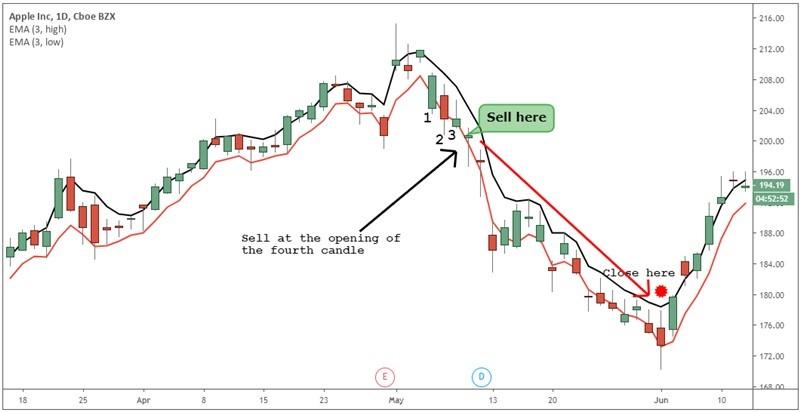
Yes, we can combine the 3 Bar EMA trading technique with the candlestick patterns analysis. For a sell signal, wait for three consecutive candles to have opened and closed near the EMA-lows.
Look at the chart below to better understand how the strategy works.
Continue Reading at Trading Strategy Using 3 Bar EMA
Candlestick
You can find candlesticks on trading platforms that provide visual price charts for technical analysis. In addition, financial news websites like Bloomberg, Reuters, and Trading Economics often display interactive charts with candlestick patterns alongside market news and analysis. Many mobile trading apps offered by forex brokers also include charting capabilities with candlestick displays.
- When you need to identify trend reversal.
- When you need to confirm trend continuations.
- When you need to easily spot support and resistance levels.
- When you need to read market sentiment
- When you need to time entry and exit points.
- When you need to confirm other technical tools and indicators.
- When you need to quickly evaluate market volatility.
- When you need to confirm breakouts and rebounds.
- When you need to filter false signals.
- To provide a clear and intuitive way to see price movements over a specific time frame.
- To highligh potential buying and selling pressure.
- To signal potential trend continuations, reversals, or periods of indecision.
- To enhance your analysis and provide further confirmation for trading decisions.
- To indicate the dominance of buyers or sellers during the time frame.
- To gauge the market's confidence in the current trend and identify potential turning points for entry or exit opportunities.
- To encourage discipline in your trading as having a visual representation of market sentiment can help you avoid impulse decisions based on emotions news headlines.
- To help you stick to your trading strategy and enter or exit positions based on concrete technical insights rather than intuition.
