 Dedicated FREE FOREX VPS
 Free FOREX Virtual Private Server
 MT4 Demo Contest, Get $500
 Sign Up for an Account, Claim 60% Deposit Bonus
 Free MT4/MT5 VPS 2024
 Send E-mail and Get Free Merchandise
 $1K Refer a Friend Bonus for Pepperstone Pro clients
 Maximize Your Earnings with 100% Deposit bonus
 Trade to Win, $5,000 Monthly Demo Contest
 Claim 30% + 15% Deposit Bonus from LiteFinance
Inverted hammer is a bullish reversal candlestick pattern. To avoid mistakes when trading with this signal, do carefully read the following article.
For traders, candlestick charts hold a huge amount of information that can probably decide their fate. Every pattern in the chart shows different meanings and functions. Thus, traders must know what kind of pattern they're seeing and how to use it in trading. Today, we'll talk about the Inverted Hammer pattern and how to correctly use it.

What Is an Inverted Hammer?
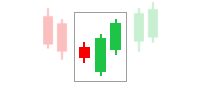
For veteran traders, the term "Inverted Hammer" might be familiar. The Inverted Hammer is a variation of the regular hammer pattern in the single Japanese candlestick pattern. It is a bullish reversal pattern that indicates the price will go into an uptrend. It is called an Inverted Hammer because the candlestick makes an upside-down hammer position. The opposite of it is the Shooting Star pattern.
Why Is It Formed?
The formation of an Inverted Hammer usually happens after a long downtrend. It indicates that the price decrease will come to an end. Thus, it's also called a bullish reversal pattern. The ability of prices to rise significantly indicates that there is buying pressure. What happens during the next candlestick after the Inverted Hammer pattern tells traders whether to buy or wait for other confirmations.
Before going into how you utilize this pattern, let's see a small example:
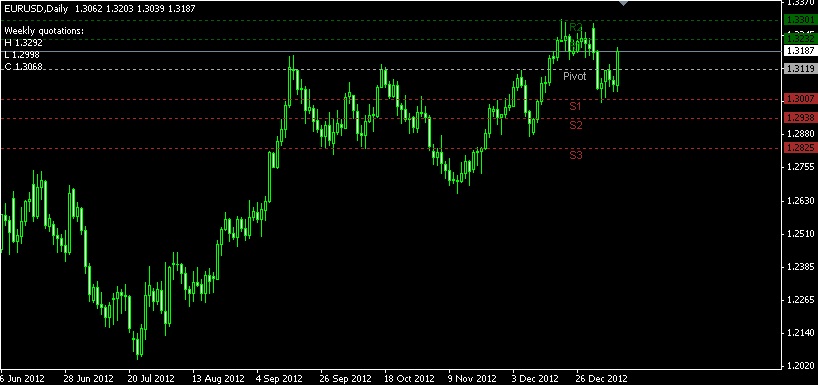
Let's say you're following EUR/USD, which is in a downtrend with a closing price of 1.11972. The next day, it opens at the same level with an intra-day low of 1.11935 and a high of 1.12297. EUR/USD then closes at 1.12060, creating an Inverted Hammer pattern as seen below. Over the next day, the price increases to 1.13320, confirming that the Inverted Hammer signals a reversal to the upside.

How to Distinguish Inverter Hammer?
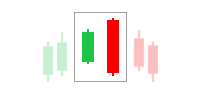
As previously mentioned, the opposite of Inverted Hammer is Shooting Star. The form of these two candles is identical. A real short body meets a long upper wick and a tiny lower wick (or no lower wick at all). Both can be regarded as possible trend-reversal signals. But, the only distinction between them lies in the position they take in the chart.
One of the ways to identify an Inverted Hammer is that it always appears as the final element of a downtrend. On the contrary, the Shooting Star appears at the top of an uptrend and marks the possible downward price movement. In a nutshell, these two patterns are similar in shape but provide opposing reversal directions.

How to Utilize Inverted Hamme in a Strategy?
If a trader considers certain variables and circumstances, this pattern can be incorporated into a lucrative day trading strategy. Because this is a bullish candlestick pattern, only the buying setup is considered.
- Reversal point: It is critical to spot potential price reversal points on the chart. These can be levels of support and resistance, rising trendlines, and so on.
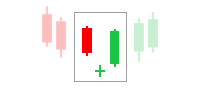
- Accuracy: The longer the top wick, the more probable a reversal will occur. The color of the candle is unimportant, however, a white (green) candle is considered a more bullish indicator than a black (red) candle. Take note of the body of the confirming candlestick. The greater it is, the weaker the bullish reversal will be.
- Time to enter the trade: Entering the trade after the confirmation candlestick formation is OK. Such a technique implies that the risks of entering a transaction are smaller. But, keep in mind that this is a conservative approach so you might end up buying at a higher price.
- Stop-loss: Traders establish stop-loss limits based on their trading opinions. However, as a general rule, they should be at least 2-3 pips lower than the Inverted Hammer's low. Trading candlestick patterns can never be regarded as a failure if the stop-loss is rigorously followed.
Confirming Inverted Hammer Signals
Any trader should be aware that no pattern may be completely instructive when used or studied on its own. A mere Inverted Hammer candle is insufficient for effective trading, whether in forex, stock, or even cryptocurrency. Other important things to consider while looking for a trade opportunity are price activity and the Inverted Hammer candle position. If a trader is confident that they have correctly spotted the pattern, it is recommended to start looking for further signs to indicate a likely reversal.
As the Inverted Hammer cannot be considered a decisive signal, it works well combined with some classic technical analysis patterns.
Double Bottom
One of the most reliable reversal patterns is the Double Bottom. Its form is similar to a "W" letter since it consists of two almost equal low points separated by a modest peak. An Inverted Hammer at a second bottom would verify a Double Bottom pattern and vice versa. Since both patterns indicate that the market is moving upward, a trader must wait for the market to close above the Inverted Hammer's high before executing a long trade.
V-Bottom
This is another technical analysis pattern named after a letter. It has the form of a "V" letter and arises when price momentum shifts from aggressive selling to extreme buying. Typically, the Inverted Hammer appears before a trader initiates the deal. When the market closes above the Inverted Hammer's high, it's time to go long. Keep in mind that these two patterns must be traded with a support level since they like to bounce off the trends.
Of course, there are other applications for the Inverted Hammer in trading. Traders, for example, might profit from pullbacks in an upswing. In this case, the Inverted Hammer indicates a probable entry on a pullback.
Pros and Cons
It should be noted that there is no perfect setups that will work in every market condition. The Inverted Hammer is no different. Using this candlestick has numerous apparent advantages. This pattern, for example, is not difficult to recognize and the potential for reward is rather significant.
However, these benefits are coupled with drawbacks. The primary disadvantage is shared by all methods and circumstances. A perfectly detected pattern may fail for no apparent reason. The Inverted Hammer candle may indicate a brief increase but not a longer-term trend. Furthermore, extra validation is sometimes needed, which results in a loss of opportunities. Likewise, new traders may confuse this pattern with its bearish variant, the shooting star, which was previously stated. Even though the differences are obvious, they may overlook them.
Final Words
Candlestick charts are an important component of technical analysis. The likelihood of success is heavily dependent on how well a trader understands and employs candle patterns in their trading, regardless of the asset. A candlestick cannot be used as a trading indicator on its own. When reading the candlestick, it is preferable to have a holistic point of view.
The convergence of elements, rather than a single one, is the foundation that cannot be overlooked. The term "reversal" should not be interpreted literally. If an Inverted Hammer appears on the chart, it does not always imply that the price will shift and move in the other direction with the same momentum as the previous downtrend. It indicates a shift in market mood, but it does not necessarily a major one. So, traders should always be on the lookout for additional indicators of upcoming changes. Nevertheless, an Inverted Hammer candlestick may undoubtedly be a beneficial tool when combined with other technical readings.


1 Comment
Hector
Nov 5 2022
What I can learn from your article is:
Thank you for sharing your knowledge!