Dedicated FREE FOREX VPS
 Free FOREX Virtual Private Server
 MT4 Demo Contest, Get $500
 Sign Up for an Account, Claim 60% Deposit Bonus
 Free MT4/MT5 VPS 2024
 Send E-mail and Get Free Merchandise
 $1K Refer a Friend Bonus for Pepperstone Pro clients
 Maximize Your Earnings with 100% Deposit bonus
 Trade to Win, $5,000 Monthly Demo Contest
 Claim 30% + 15% Deposit Bonus from LiteFinance
Candle wicks are useful for many things, including identifying trends. Learn how to use this knowledge to better spot opportunities from price trends.

Analyzing the market is one of the most crucial skills every forex trader must possess. To execute a good trading plan, the trader must be able to read the chart and make decisions based on the conclusion.
From the seemingly random price chart, you can actually gather a bunch of information and data needed for your trades. If you cannot analyze the market well, there's a high chance that you will make false predictions, increasing the risk of losing money.
Moreover, in the basic knowledge of forex trading, one must understand how to identify the market trend as well as its relative strength. This is what allows us to trade with momentum and find favorable opportunities.
Determining the market trend can be easy, depending on your method. Some use technical indicators to help them spot the trend, while others use pure price action and multiple time frame analysis to figure out the short-term and long-term trends. Today, we're going to discuss one of the easiest techniques that you can use to identify the market trend.
Identifying Trend Direction with Candle Wicks
One of the easiest ways to identify the market trend is by using long wicks. A wick is the line that's attached to the body of the candlestick and used to signal where the price has fluctuated relative to the opening and closing prices. There are two keys that you can apply in relation to the function of the axis and its relation to the direction of the trend, namely:
- If the wick is below the body, the price has a tendency to reverse towards the top (bullish reversal).
- If the wick is above the body, the price has a tendency to reverse downwards (bearish reversal).
The length of the candle wick basically shows the high and low of price movement within a specific period and this can somewhat signal what the next movement is going to be.
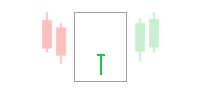
Candles with long wicks but small bodies are usually known as reversal candles. Thus, if you spot a long wick candle, there's a high probability that the price trend is going to reverse.
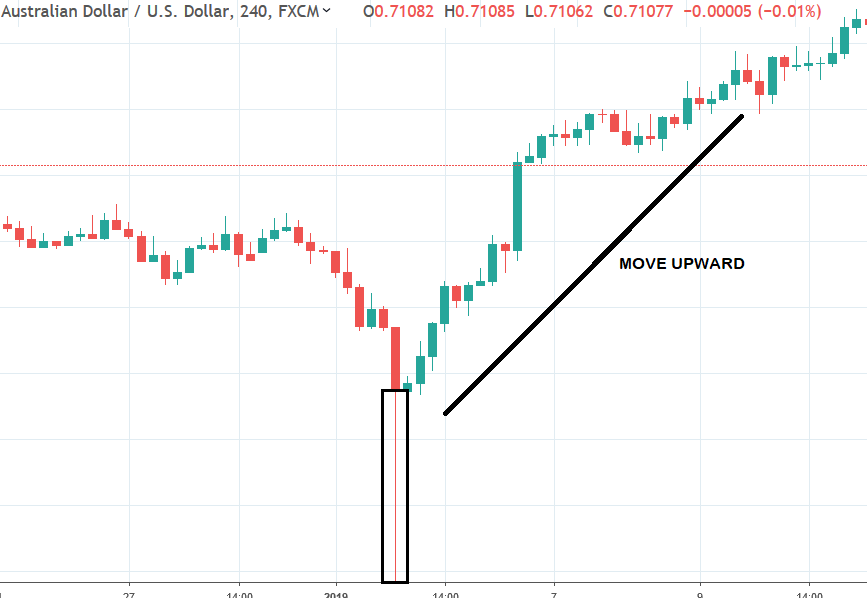
From the chart below, notice that the long wick is located below the candle's body. This means that the sellers were pushing the price down. However, it turns out that they were not strong enough and so the buyers were able to drive the price up.
Since the buyers overpowered the seller's pressure, there's a high chance that the strength will carry forward and continue moving the price upward.
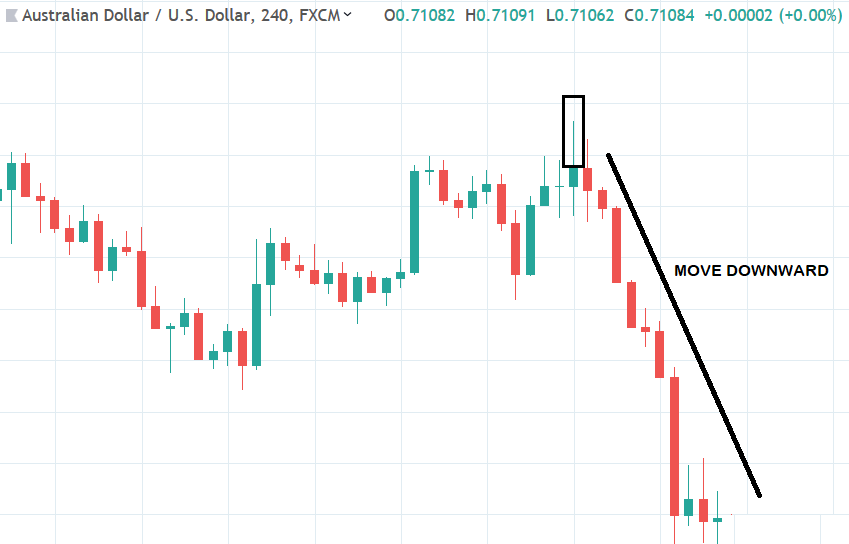
On the other hand, the same principle also applies to the long wicks that appear above the candlestick but only in the opposite direction. Take a look at the example below. The long wick above the candle's body shows sellers are starting to dominate the market. Even though the candle is bullish, the long wick shows strong resistance from the sellers. As a result, we can assume that there will be a bearish reversal and that the price will continue moving downward.
Trend Following Strategies to Try Out
As explained in the previous section, you can identify the trend using long wick candles. However, such a method might not be enough to provide strong trading signals. This is why you need to combine it with trading indicators. Technical indicators can provide useful information such as trend identification, entry signal, exit signal, and more. The following are some strategies you should consider:
1. Moving Average
Moving Average (MA) is easy to use and provides trading signals with excellent accuracy. Most forex traders use Moving Average to identify the current and following trends. Moving Averages are also easy to adjust and can measure the average price movement for a certain period. If you spot a long wick candle followed by a change in the direction of the MA line, then you can confirm that there's a trend reversal.
See Also:
2. Trading with Bollinger Bands
Bollinger Bands is one of the most popular technical indicators in forex trading. It consists of three "bands": the upper, middle, and lower. The fluctuations of those bands can be used to measure volatility and determine the direction of the trend in the market. The appearance of a long wick candle that indicates a price reversal will be further confirmed if there's a rebound from the upper band of the Bollinger Bands.
3. Trading with Parabolic SAR
Parabolic SAR is another useful technical indicator that could help you highlight the trend's direction and provide entry and exit signals. The indicator appears as a set of dots, either above or below the market's price, depending on the direction of the price movement.
If the dot is located below the price, then the price is in an uptrend. Conversely, if the dot is located above the price then the price is in a downward trend. If you spot a long wick candle followed by a change in the position of the Parabolic SAR dots, it's considered a reliable signal for reversal.
4. Breakout Trading
Lastly, another trend strategy that you can use is called breakout trading. Breakouts can happen when prices break through important levels, such as support and resistance. Usually, when a breakout occurs, the price tends to continue moving in the same direction as the current trend. Many traders like to take advantage of such momentum and maximize their gains from the rapid price movement.
However, remember that sometimes the price can break through a certain support or resistance level but doesn't have enough momentum to maintain its position, so it reverses back to the initial direction. This situation is commonly known as a fake breakout. Therefore, you need additional signals to confirm the breakout.
The Bottom Line
Determining market trends is a highly useful skill in forex trading, especially for technical traders. In fact, trend strategies are widely known to be among the best strategies to maximize gains in the forex market. As explained above, there are a couple of ways to take advantage of the major trend in the market. Some of them are very easy to follow, even for beginners. But above all, the most important thing is to match the strategy with your trading style in general.
Just remember to plan your actions carefully and always calculate the risk. You can try different ones and even adjust the strategy on a demo account before going live.