 Dedicated FREE FOREX VPS
 Free FOREX Virtual Private Server
 MT4 Demo Contest, Get $500
 Sign Up for an Account, Claim 60% Deposit Bonus
 Free MT4/MT5 VPS 2024
 Send E-mail and Get Free Merchandise
 $1K Refer a Friend Bonus for Pepperstone Pro clients
 Maximize Your Earnings with 100% Deposit bonus
 Trade to Win, $5,000 Monthly Demo Contest
 Claim 30% + 15% Deposit Bonus from LiteFinance
It's easy to get trapped on the wrong side of the market and lose money. What if we tell you that understanding the movements of institutional traders can actually help you?

As a retail trader, it's almost impossible to straight-up beat these giant players due to the power comparison. So, instead of fighting them, why don't we try to take advantage of their positions in the market?
Foreign exchange is a highly decentralized market. Unlike the stock market, there is no physical location for the recording of order flow. Typically, in forex trading, such information can only be obtained by banks and larger institutional players.
According to a study produced by the Bank of International Settlements that was originally published in 2013 and revised in 2016 about client flows in forex trading, the flow of institutional traders reflects a significantly superior alignment with future pricing than that of corporate and private traders' flows.
To put it simply, the power imbalance in forex trading gives a huge advantage to institutional traders.
Their order flow is usually so powerful that it can drive the price to move in a certain direction, hence creating a trend. But don't lose hope just yet because fortunately, there is still a way to analyze market sentiment for retail traders, and that is through the Commitment of Traders data report.
What is the COT Data?
Every week, the Commodity Futures Trading Commission (CFTC) releases a Commitment of Traders (COT) report regarding the positioning of participants in the currency futures market.
The data basically track the positioning of commercial players like corporates and private traders, as well as non-commercial players like banks and institutions.
The report is usually published on Thursday or Friday, and the data itself consists of the positioning over the weekly period starting from the Tuesday of the previous week to the Tuesday of that week.
To find the data report, you can go to the CFTC's official website or search for the weekly data from websites that basically summarize the COT data report and present it in the form of visual graphics.
How to Read COT Data
Once you open the data report, you might find it intimidating at first due to the long and complicated set of texts, but with a little effort, you'll be able to find exactly what you're looking for straight away.
You simply need to press CTRL+F or another search function on your keyboard and type in the currency that you want to find. For instance, if you want to find GBP, just search "Pound Sterling" and you'll be taken to the section that contains GBP data.
Here's an example of the search result.
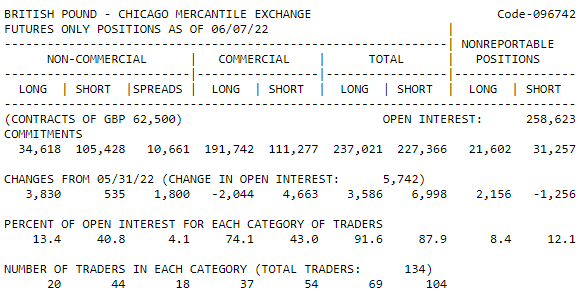
Now, for beginners, those data might still look confusing and difficult to understand because it's still very raw.
To make things easier, you can refer to data graphics provided by third-party websites. Take a look at the graphic below.
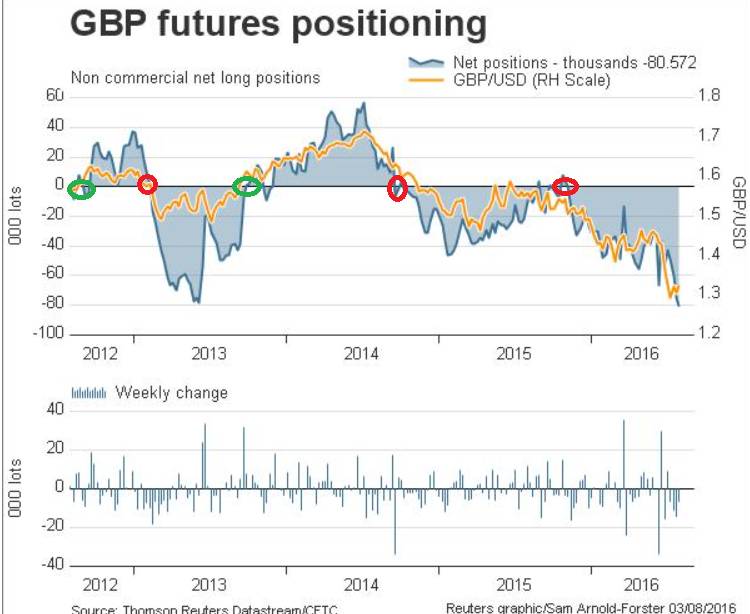
The chart above shows the Non-Commercial positioning for GBP/USD in 2012. The yellow line represents the price and the shaded blue area represents the positioning.
When the blue area crosses above the center line that cuts in the middle of the chart, it represents a net-long position. In contrast, when the blue area crosses below the center line, it represents a net-short position.
In addition, the red circles show the times when positioning flipped from long to short and the green circles show the times when the opposite scenarios happen.
We can see that out of the eight times positioning cross-overs, six of them resulted in the creation of a strong trend. This is actually rather valuable information to have because it presents trading opportunities in the near future.
To generate profit from the major trends, just simply follow the direction of the non-commercial players.
How to Use COT Data
To use the COT data and incorporate it into your trades, there are three aspects that you need to focus on, namely:
1. Identify a Change in the Positioning
In the previous example, changes in the positioning are highlighted by the red and green circles. Knowing when the major players are shifting their positions can be a huge advantage for retail traders to spot the forming of a new trend.
2. Identify the Periods of Extreme Positioning
While following the trend is clearly a profitable strategy to use, we need to remember that all trends must end at some point. Therefore, it's also important to know when price reversals could happen.
One of the most reliable signals that you can use to identify potential reversals is when positioning moves to extreme levels. Typically, this can be translated into exhaustion and capitulation of the trend, so it presents an opportunity to open a new position or close the current one.
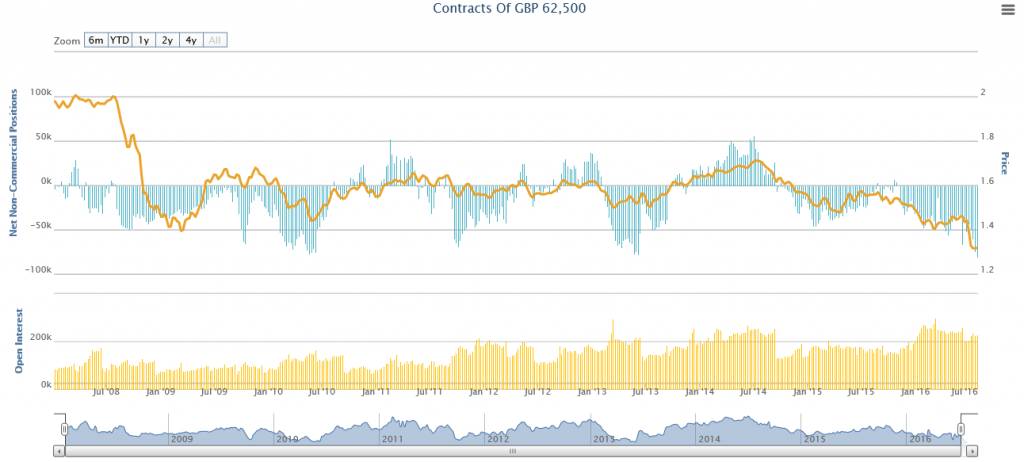
We can see from the chart above that every time the positioning moves near +50, the price tends to rally shortly after, and every time the positioning moves near -50, the price tends to fall shortly after.
3. Identify Divergent Positioning
Divergence is another way of telling that there's a potential reversal on the chart. You simply need to identify when the positioning is moving in the completely opposite direction of the actual price. Let's take a look at the chart below.
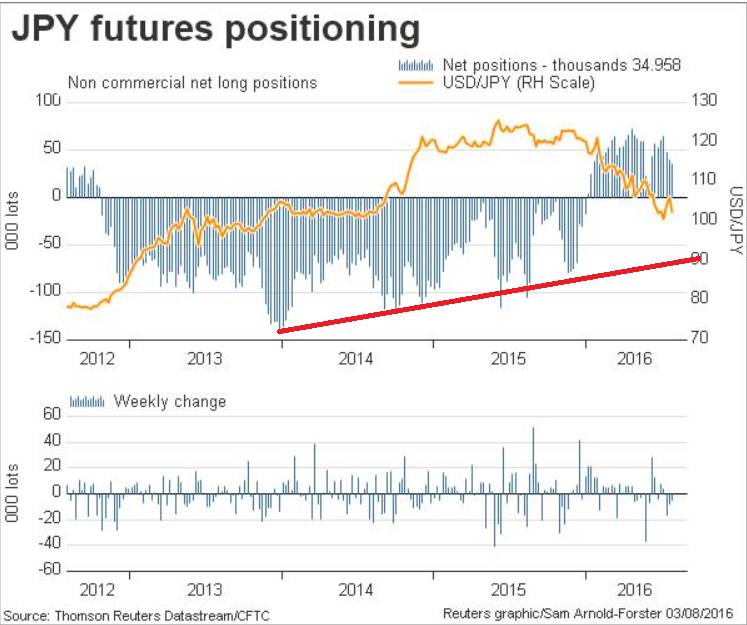
From the chart above, we can see that the price of the USD/JPY (the yellow line) is moving upward, yet the positioning (the blue area) is moving downward.
This shows that the major institutional players are getting less interested in the trade and probably preparing for the next shift in position.
Potential Issues and Risks
Although the data can undoubtedly provide useful information to help retail traders map out the order flow of a market and identify potential reversals, it's still not completely free of risk. Here are some of the potential issues that you need to be aware of:
Backdated Data
The COT data is considered backdated, which means that the information you get is actually based on the market's past performance. More specifically, it's the data of the positioning of institutional traders in the previous week, not the present day.
It's true that most of the time, institutional traders follow a directional path, so we can assume that they're going to move in a certain way during a certain condition.
However, this is not always the case, so the analysis might not be accurate at times when it's used to predict future price movements. This is why, rather than using the week-on-week data, you should pay attention to key actions like a shift in positioning, extreme positioning, and divergence.
It Doesn't Cover the Whole Market
Another issue is that sometimes, the data does not reflect the real condition of the forex market. It's worth noting that the COT data can only track a specific portion of the market's order flow.
Consequently, the price might not always follow the data and provide a perfect signal for your trade.
Bottom Line
From the explanation above, we can conclude that understanding institutional players' positioning is very important for retail traders.
The COT data report is a powerful tool to analyze market sentiment and track the movements of big market players. You can use the data to develop a solid plan to ensure that your trade is moving on the right side of the market.
However, we've also mentioned that the strategy is not 100% accurate at all times. There are potential drawbacks that you need to consider, so make sure to use proper risk management and not trade more than you can afford.