Dedicated FREE FOREX VPS
 Free FOREX Virtual Private Server
 MT4 Demo Contest, Get $500
 Sign Up for an Account, Claim 60% Deposit Bonus
 Free MT4/MT5 VPS 2024
 Send E-mail and Get Free Merchandise
 $1K Refer a Friend Bonus for Pepperstone Pro clients
 Maximize Your Earnings with 100% Deposit bonus
 Trade to Win, $5,000 Monthly Demo Contest
 Claim 30% + 15% Deposit Bonus from LiteFinance
Random Walk Index is an uncommon indicator among forex traders. Yet, it can help them with 3 different methods of technical analysis.
Trading is one way to collect profits, but it also comes with high risks. There are many techniques and indicators that traders can use to help them make decisions. One technical indicator that can be used in forex trading is the Random Walk Index (RWI).
The indicator was created by Michael Poulos to determine whether the current price movement of an asset shows a "random walk" or the result of a statistically significant trend, either up or down. Forex traders can use RWI to identify buy/sell signals, look for entry confirmation, and monitor possible divergences.
Random Walk Index (RWI) at a Glance
RWI refers to market or security movements that are within the statistical noise level and are inconsistent with confirmed or determinable trends. This technical indicator was originally published by one of the "Stocks and Commodities Technical Analysis" magazines in an article entitled "Of Trends And Random Walks."
Studies on market trends and the Random Walk Index have been going on for several decades, marked by William Feller's publication on probability theory, proving that the limits of randomness or "displacement distances" can be calculated by taking the square root of the sum of binary numbers, which refer to two-sided outcomes with equal probabilities.
Logically, any movement beyond these boundaries indicates that the movement is not inherently random. RWI applies these mathematical principles when measuring the direction of trends and determining whether the trend is occurring randomly or is statistically significant.
Therefore, RWI is a technical indicator that can help traders identify whether the market price is trending or just following random movements. Additionally, this indicator is used to measure the strength of the trend and the likelihood of price reversals. RWI displays reversal signals by showing points where the price crosses the upper or lower boundaries that are set. If the price crosses the upper boundary, it indicates a possible downtrend; if the price crosses the lower boundary, it indicates a possible upward trend.
See Also:
The Formula of Random Walk Index
Since the RWI measures the strength of upward and downward trends, this indicator has two lines and requires separate calculations for both.
The formulas for calculating the Random Walk Index (RWI) High and Low are as follows:
RWI High = Close (today)/High (n period)
RWI Low = Close (today)/Low (n period)
RWI is commonly applied with 10-day period. So, if a trader wants to calculate RWI High and Low with a 10-day period, then the trader will use the last closing price and the highest and lowest prices during the last 10 days to calculate it.
3 Ways of Using Random Walk Index (RWI) in Forex Trading
There are several ways forex traders can use RWI in forex trading, which include:
1. Use Crossovers to Spot Buy/Sell Signals
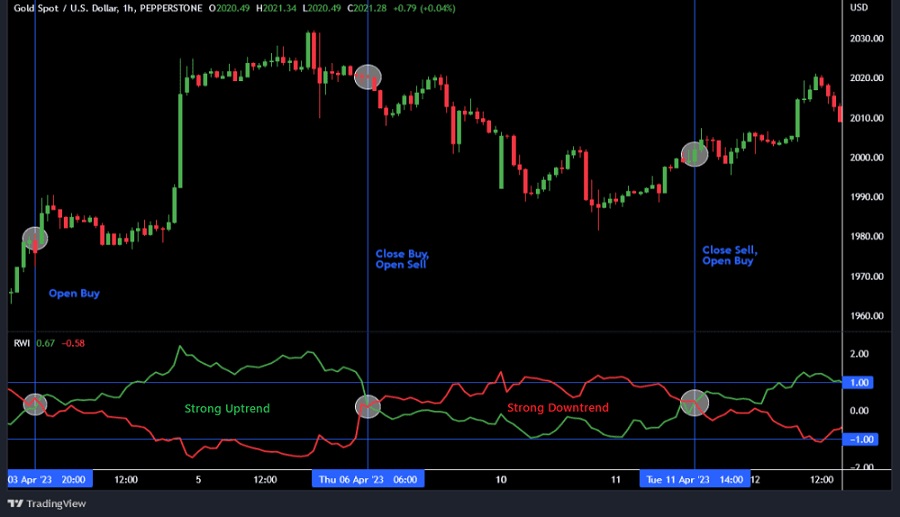
One of the most common ways to use RWI is waiting for crossovers to identify any buy/sell signal. When RWI High crosses above RWI Low and reaches 1.00, this can be considered a buy signal. Conversely, when RWI Low moves above RWI High and the level is 1.00, then you can consider it as a sell signal.
For example, if you look at the XAU/USD chart below, a crossover of RWI High above RWI Low that reaches 1.00 indicates a strong upward trend. On the other side, RWI High crossover to the downside signifies the start of a downward trend.
2. Confirm Trading Signals
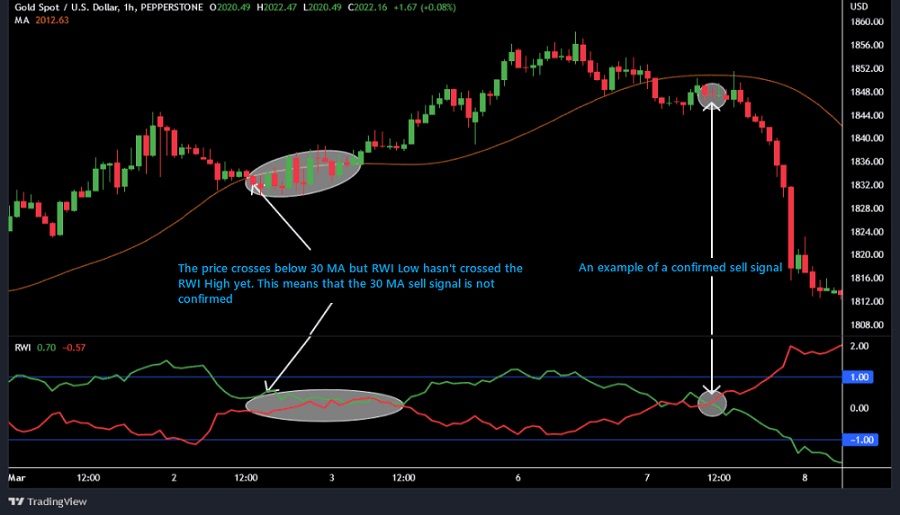
Forex traders can also use RWI to confirm signals that arise from other technical indicators. If another signal shows a bullish reversal but RWI High shows that the trend is random, then it is recommended that you do not make any trade.
This chart shows the difference between the Moving Average (MA) indicator and Random Walk Index, where the price crosses below the MA, but RWI High shows that the trend is random. Such a situation recommends you to wait for further confirmation before deciding to enter a short position.
3. Identify Divergence as a Reversal Early Sign
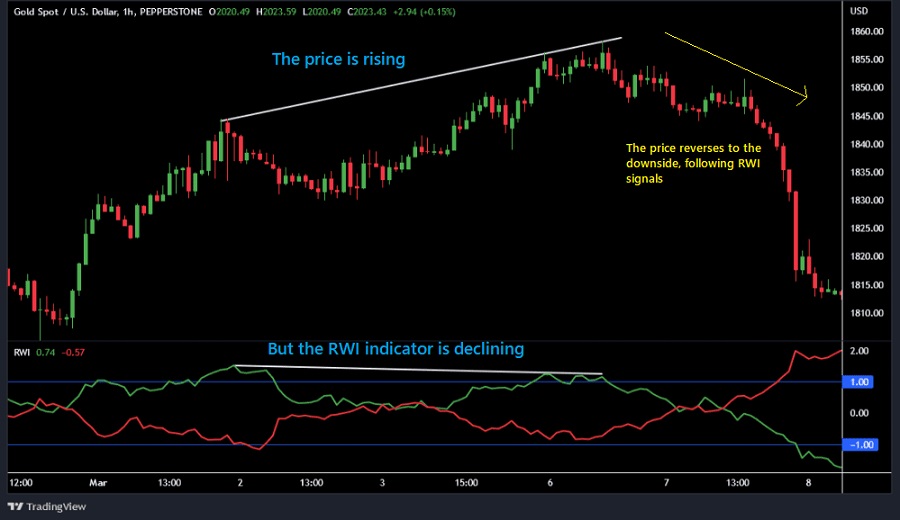
RWI can also help forex traders identify upcoming reversals before they happen through divergence analysis. Divergence occurs when the direction of price movement and RWI do not match. For example, if the price continues to rise but RWI shows that the price is weakening, this can be a signal that the price is likely to reverse downwards.
Random Walk Index Drawbacks
Like any other technical indicator, the Random Walk Index (RWI) has shortcomings and limitations that forex traders need to be aware of:
- Incompatible to sideways markets. RWI tends to provide less accurate signals in sideways markets or in markets that do not have a clear trend. This is because RWI is designed to measure the strength of trends.
- Delayed signals. RWI uses historical data to calculate trend strength, so you should note that RWI is a lagging indicator.
- Need other indicators. RWI should be used together with other technical indicators, as RWI alone cannot provide sufficient information to make trading decisions.
- Not always accurate in highly volatile markets. RWI is less effective in volatile markets since rapid and sharp price movements can make RWI signals less accurate.
Therefore, it is recommended that you use RWI together with other technical indicators to make better and more accurate trading decisions. In addition, you should also pay attention to current market conditions and adjust the use of RWI according to the characteristics of the pair you are trading.