Dedicated FREE FOREX VPS
 Free FOREX Virtual Private Server
 MT4 Demo Contest, Get $500
 Sign Up for an Account, Claim 60% Deposit Bonus
 Free MT4/MT5 VPS 2024
 Send E-mail and Get Free Merchandise
 $1K Refer a Friend Bonus for Pepperstone Pro clients
 Maximize Your Earnings with 100% Deposit bonus
 Trade to Win, $5,000 Monthly Demo Contest
 Claim 30% + 15% Deposit Bonus from LiteFinance
Moving Averages Convergence Divergence (MACD) is a lagging indicator, but is very useful on trending market. This article will reveal how we can predict price trend using this particular indicator.
In previous articles, we have spoken about three technical indicators, that is stochastics, pivot point, and moving averages. Moving Averages is a lagging indicator, and very useful on trending market.
Pivot Point, on the opposite, is a leading indicator that gives prediction on where the next price movement ranges would be. While Stochastic is a unique oscillator indicator that predict price movement through divergence.
MACD too, is an oscillator indicator.
MACD Setup
Moving Average Convergence Divergence (MACD) is a variation of moving averages categorized among oscillator indicators, they are indicators that moves within a certain range.
Movements within the range indicates when a pair is overbought or oversold. As an oscillator, MACD is constructed by two different paced exponential moving averages (EMA) and one that is much slower than the first two.
A common way of constructing MACD is (12, 26, 9). The three numbers refer to:
- A fast-paced moving averages.
- A slower-paced moving averages.
- The bars used to calculate moving market price averages from the difference between the fast MA and the slower MA.
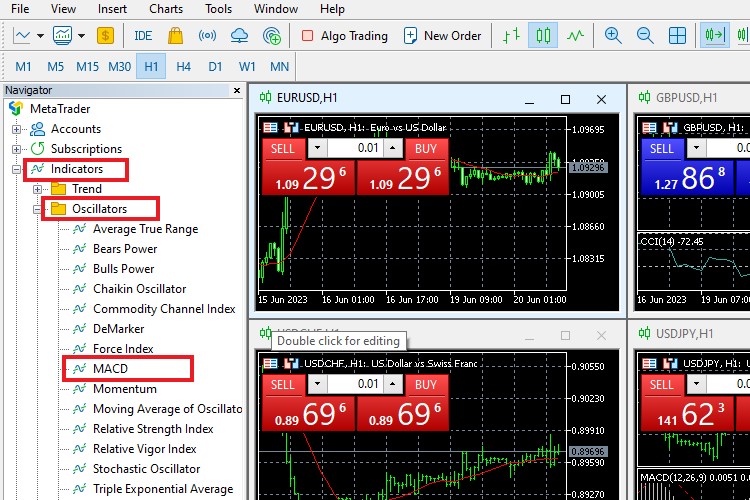
In your trading platform toolbar, click through 'insert' > 'indicators' > 'oscillators' > 'MACD', then you will see a pop-up box where you will have to fill in the blanks with those numbers as follows.

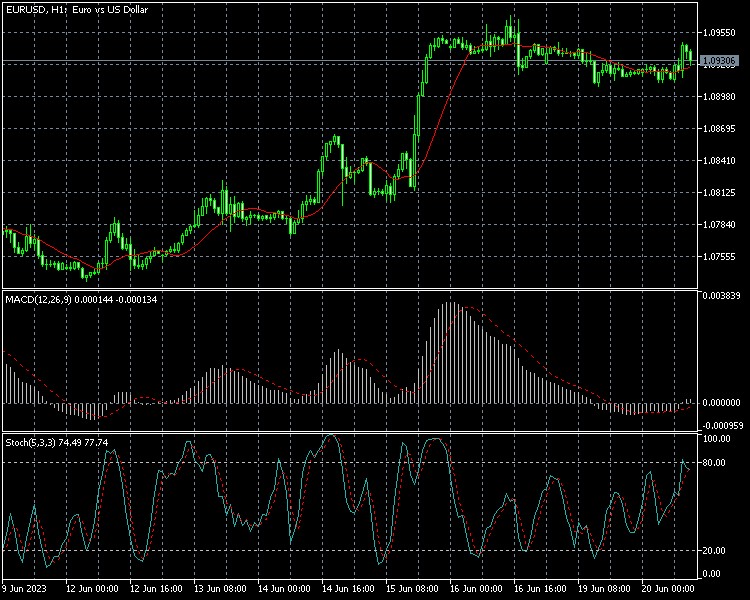
Afterward, MACD will show up on chart just like in the picture below.

It was a shoot from USD/JPY chart in 30 January 2014. To make it clearer for you, I've taken a close up of the MACD.

See the lines and the histogram. They move dynamically past each other. Note the 0.0 line; it is the signal line. When MACD fly above the line, it shows a bullish trend, and when it sneaks under that line, then there is a bearish trend.
When the gap between the red line and the histogram widen, it means the end of the trend is coming. When the histogram rises above the red line over 0.0 line, it means there is an overbought, and signals that price will return to normal.
When the histogram goes down longer than the red line under 0.0 line, it means there is an oversold, and signals that price will return to normal.
Using MACD for Analysis
The (12, 26, 9), is a default input for MACD in trading platform Metatrader 4. However, the signals produced are not guaranteed. Therefore, you could customize MACD yourself by filling in other numbers on the pop-up box.
There are some who suggest 21, 55, and 9. The fewer signal there is, the more reliable it is.
MACD is best used together with other indicators on the chart, because of its inability to detect the strength of a certain signal. With MACD, we have the freedom to choose entry-exit points, but it also made us vulnerable on sideways market.
A known combi in stock trading is MACD and Stochastic. The two oscillators work well together and ensure that you could choose the best entry/exit points.
Another strategy with MACD was published by Markus Heitkoetter from Rockwell Trading, combining it with Bollinger Bands for a simple day trading strategy. It is also possible for you to combine it with MA crossovers like EMA-20 and EMA-60 crossover.
On the third picture, I used MACD and MA crossover. It seemed okay. Try it if you would like to, or combine it with whatever indicator you happen to use. Happy trading!
If you're a day trader, you might want to consider using the best MACD setting for your strategy. Like it just said, MACD helps traders to identify the direction and strength of a trend in the market. It will be valuable for day traders as they seek to capitalize on short-term price movements within a trend.