 Dedicated FREE FOREX VPS
 Free FOREX Virtual Private Server
 MT4 Demo Contest, Get $500
 Sign Up for an Account, Claim 60% Deposit Bonus
 Free MT4/MT5 VPS 2024
 Send E-mail and Get Free Merchandise
 $1K Refer a Friend Bonus for Pepperstone Pro clients
 Maximize Your Earnings with 100% Deposit bonus
 Trade to Win, $5,000 Monthly Demo Contest
 Claim 30% + 15% Deposit Bonus from LiteFinance
Did you know that the choosing periods in EMA could be determined by Fibonacci levels? Also, what are the preferred MA periods to apply the crossover strategy?
Moving averages are a widely used technical indicator in all instruments, and there are many interesting facts that traders should be aware of when using them. From the different types of moving averages available to how they can be used to generate buy and sell signals, there is much to learn about this versatile indicator.
In this article, we will explore 3 fascinating and useful facts about popular moving averages:
- The most popular periods: 50-day and 200-day moving averages.
- The users: all types of traders from novice traders, fund managers, to investment banks.
- How to use them: golden cross and death cross.
Whether you're a seasoned trader or just starting to learn about technical analysis, this information will help you understand and utilize moving averages more effectively. So, let's dive in and discover some of the most interesting facts about this popular indicator.
1. What Are the Most Popular Moving Averages?
Moving average (MA) is a popular technical indicator used in forex and stock market analysis. It is used to smooth out the volatility of an instrument price by calculating the average price over a certain period.
The most commonly used moving averages are the 50-day and 200-day moving averages. The 50-day moving average is utilized to identify short-term trends, while the 200-day moving average is used to identify long-term trends. Traders often use moving averages in conjunction with other technical indicators to make more informed investment decisions.
Additionally, crossovers of moving averages can indicate a change in trend and be used as a buy or sell signal. For example, if a stock's 50-day moving average crosses above its 200-day moving average, it may indicate a bullish trend and be a signal to buy the stock. Conversely, if the 50-day moving average crosses below the 200-day moving average, it may indicate a bearish trend and be a signal to sell the stock.
There are different types of moving averages, such as simple moving averages (SMA) and exponential moving averages (EMA). The main difference between them is that SMA gives equal weight to each data point, while EMA gives more weight to the most recent data points.
This means that EMA will respond more quickly to recent price changes. The choice of which type of moving average to use will depend on the individual trader's preferences and trading strategy.
Popular Simple Moving Averages
The concept behind this moving average is quite simple: they are calculated by taking the average of a certain number of past prices over a specific period.
The most popular SMAs include the 10-day SMA, 20-day SMA, 50-day SMA, 100-day SMA, and 200-day SMA. These averages are determined by the number of trading days in the specified period. For example, a 10-day SMA would be calculated by taking the average of the closing prices for the last 10 trading days.
Traders often use the shorter, quicker simple moving averages as entry triggers, which means they use them to signal when to enter a trade. The longer, slower-moving averages are used as trend filters.
They are utilized to identify the overall direction of the market. Some traders use these longer moving averages as a way to confirm or deny a trend. They also use these averages to decide whether to hold on to a position or exit it.
In addition, many traders apply multiple moving averages at the same time. This is known as multiple moving average crossover. This strategy is based on the idea that when a faster moving average crosses above a slower moving average, it can signal the start of an uptrend.
But when it crosses below, it can signal the start of a downtrend.
Popular Exponential Moving Averages
While the exponential moving averages (EMA) may appear similar to simple moving averages (SMA), the underlying data points that make up the EMA are different due to the way they are calculated.
The EMA places a greater emphasis on recent price movements compared to the SMA, which takes a general average over the specified time period. The most popular EMAs include the 10-day, 20-day, 50-day, 100-day, and 200-day.
Traders who are interested in using Fibonacci numbers in their analysis often replace the popular moving average numbers with Fibonacci numbers.
The standard moving average settings: MA 20 50 100 200
Fibonacci moving averages: MA 21 55 100 200
Other Types of Moving Averages
In addition to SMA and EMA, there are several different types of moving averages, each with its own unique formulas. Over time, these formulas have been modified in an attempt to improve their ability to track price movements.
Such modified MAs include:
- Hull Moving Average
- Weighted Moving Average
- Smoothed Moving Average
Each of those moving averages has its advantages and disadvantages, and traders can choose the one that best suits their needs and trading style.
2. Who Uses Popular Moving Averages?
Popular Moving Averages are widely used by new traders. It is because of their ability to help define the trend and identify potential entry points in the direction of the trend.
However, they are not just limited to being used by new traders, but also by professional fund managers and investment banks in their market analysis. They use moving averages to determine if a market is approaching support or resistance levels or if it is potentially reversing after a prolonged trend.
For instance, the GBP/USD chart below shows how the upward momentum in the long-term trend is slowing down as the price drops and closed below the 200-day moving average. A close below the 200-day MA alerts traders to the possibility of a reversal in the long-term trend.
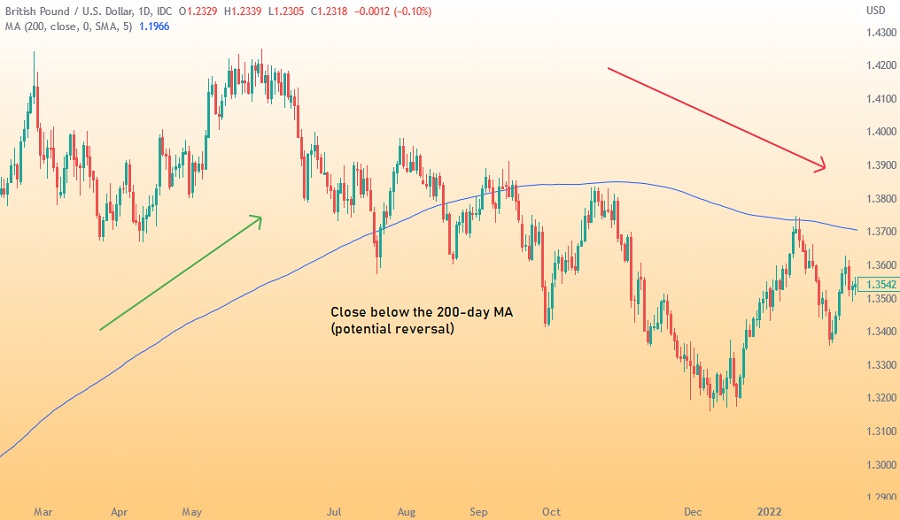
Moving averages can be a simple yet effective tool to define support and resistance levels in the forex market. The chart above shows when a market is in a strong trend, any bounce off a moving average presents an opportunity to join the trend until the price closes below the 200-SMA.
However, if the price persistently moves above and below the moving average in a short period of time, it is likely to be a range-bound market; meaning those reversals are less significant from a trading point of view.
It's worth noting that moving averages are a lagging indicator so they're based on past prices and do not predict future price movements.
3. How to Use the Popular Moving Averages?
One of the most popular uses of moving averages is to look for a moving average crossover. A moving average crossover is a signal that occurs when a short-term or faster moving average crosses above or below a longer-term moving average.
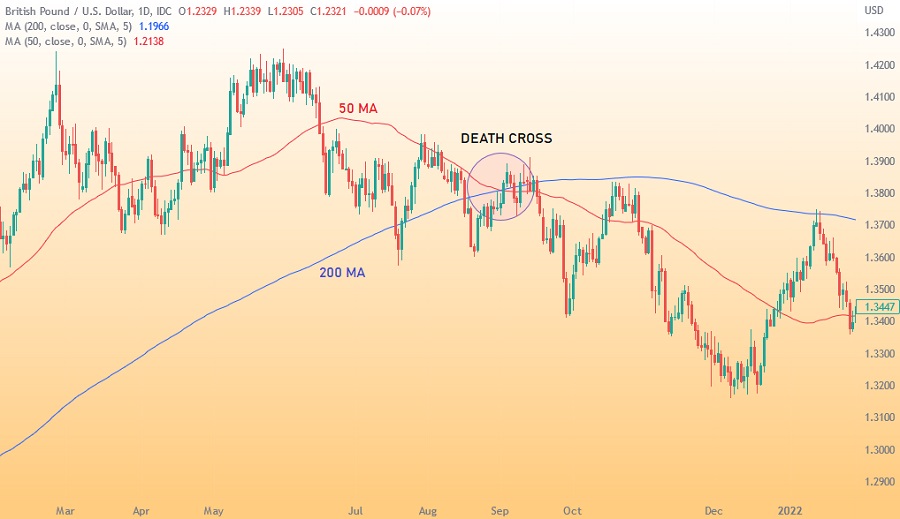
The most well-known moving average crossover system is the one that involves the 50-day (51) and the 200-day moving averages. This system is commonly known as the "Golden Cross" and "Death Cross".
- Golden Cross: This occurs when the 50-day moving average crosses above the 200-day moving average. This is considered a bullish crossover and indicates that the market is entering an uptrend.
- Death Cross: This occurs when the 50-day moving average crosses below the 200-day moving average. This is considered a bearish crossover and indicates that the market is entering a downtrend.
An example of the Death cross can be seen in the GBP/USD chart below.
Conclusion
In conclusion, Moving Averages serve a crucial role not only in entering trades but also in exiting them. The observation of bearish crossovers on existing long positions can provide valuable signals for trade exits.
Understanding the importance of exit strategies is vital for effective risk management and profit preservation in trading. Successful traders emphasize the need for establishing profit targets, stop loss levels, and continuously monitoring market conditions.
Moving Averages also can be applied across various time frames, catering to different trading styles and availability. Day traders and scalpers, who can dedicate more time to market analysis, often opt for shorter time frames, while swing traders and position traders, with limited chart time, prefer longer time frames.
By aligning the chosen time frame with individual trading goals and available resources, traders can enhance their trading strategies and pursue their desired profits from both small and significant price movements.


5 Comments
Sienta
Jan 26 2023
Could you please elaborate on the distinctive features and formulas of the Hull Moving Average, Weighted Moving Average, and Smoothed Moving Average? How do these modified moving averages differ from the traditional SMA and EMA in terms of responsiveness to price changes, lag, and overall effectiveness in trend analysis? Additionally, are there specific trading strategies or market conditions where these modified moving averages are known to be particularly useful?
By exploring the characteristics and applications of these different moving averages, traders can expand their technical analysis toolkit and potentially improve their ability to interpret price charts and make informed trading decisions. Thank you!
Potter
Jun 11 2023
@Sienta: Hey there! Let me give you a shorter explanation since discussing multiple types of moving averages can be quite lengthy. The Hull Moving Average (HMA) aims to minimize lag while maintaining smoothness by incorporating weighted moving averages. The Weighted Moving Average (WMA) assigns different weights to data points based on their position, reacting more quickly to price changes than the Simple Moving Average (SMA). The Smoothed Moving Average (SMMA) reduces noise by applying a smoothing factor to the previous SMMA value and the current price. In terms of responsiveness, the HMA and WMA are more sensitive than the SMA, while the SMMA lies between the SMA and Exponential Moving Average (EMA). The effectiveness of these modified moving averages depends on market conditions and trading strategies. The HMA and WMA are favored in trending markets, while the SMMA and SMA work well for stable trends or noise reduction.
Martin
Jun 17 2023
When it comes to trading, we know that moving averages can be valuable for identifying entry signals. However, I'm curious to know if moving averages can also be used as stop loss levels for exiting trades. Can you shed some light on how moving averages can serve as an effective tool for determining when to exit a trade? I'm particularly interested in understanding how a bearish crossover on a long position, detected by moving averages, can act as a signal to exit the trade. It would be great to learn more about how traders utilize moving averages for setting stop loss levels and managing risk.
Justin
Jun 19 2023
@Martin: Absolutely, my friend! Moving averages can indeed be used not only for identifying entry signals but also for determining when to exit trades and managing risk. Let's delve into how moving averages can serve as effective tools for trade exits. (read : Stop Loss Strategies to Protect Your Trades )
When it comes to setting stop loss levels, moving averages play a crucial role. Traders often utilize the concept of a bearish crossover on a long position detected by moving averages as a signal to exit the trade. A bearish crossover occurs when a shorter-term moving average, like the 20-day moving average, crosses below a longer-term moving average, such as the 50-day moving average.
This crossover can be interpreted as a shift in the market sentiment, indicating a potential reversal or a weakening of the bullish trend. It prompts traders to consider closing their long positions to protect their profits or limit potential losses.
By setting the stop loss level slightly below the moving average crossover point, traders aim to exit the trade if the price continues to decline, reducing the potential downside risk.
Additionally, moving averages provide dynamic support and resistance levels. Traders often use the moving average as a reference point for determining stop loss levels. For example, they may set their stop loss a certain percentage or number of points away from the moving average to ensure they exit the trade if the price moves against their position.
Jordi
Jul 3 2023
How does the effectiveness of scalping strategy differ when using Exponential Moving Averages (EMA) compared to Simple Moving Averages (SMA)? Considering that SMA gives equal weight to each data point and EMA gives more weight to recent data points, how does this difference impact the responsiveness of the moving average in capturing price changes? Furthermore, in the context of scalping, where traders aim to profit from short-term price movements, which type of moving average (EMA or SMA) is generally preferred? Can you explain how the choice of moving average type aligns with different traders' preferences and trading strategies?