 Dedicated FREE FOREX VPS
 Free FOREX Virtual Private Server
 MT4 Demo Contest, Get $500
 Sign Up for an Account, Claim 60% Deposit Bonus
 Free MT4/MT5 VPS 2024
 Send E-mail and Get Free Merchandise
 $1K Refer a Friend Bonus for Pepperstone Pro clients
 Maximize Your Earnings with 100% Deposit bonus
 Trade to Win, $5,000 Monthly Demo Contest
 Claim 30% + 15% Deposit Bonus from LiteFinance
Pivot points could provide reliable support and resistance areas so you can look for ideal entry and exit levels. There's also a strategy where you could combine it with a technical indicator.

Many forex traders like to use pivot points to help them determine support and resistance areas on the price chart. Pivot points are created based on the highest price (High), the lowest price (Low), and the closing price (Close) of the previous prices to predict the prevailing support and resistance levels.
As a trader, you might have noticed that forex trading requires some reference levels like support and resistance that could help you decide where to enter the market and where to set your stop loss and take profit. If you think about it, support and resistance levels are quite reliable to determine the amount of risk in a trade.
Without a proper risk calculation, there's a high chance of running out of funds in a short time. On the other hand, an appropriate amount of risk will give you a better opportunity to be profitable.
One of the tools that you can use to determine potential support and resistance areas is pivot points. Four things about pivot points you need to understand are:
- How to calculate pivot points
- How to measure pivot points accuracy
- Setting stop loss and take profit with pivot points
- Combine pivot points with oscillators
In this article, we're going to analyze the accuracy of pivots and demonstrate how to combine pivot points with other technical indicators in forex trading to make a stronger analysis.
Contents
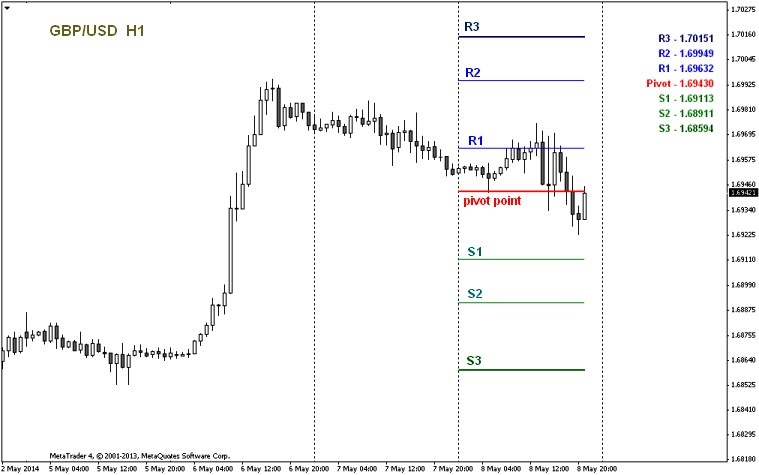
How to Calculate Pivot Points
Pivot points were originally used by stock and futures traders, but now it's also applicable to forex trading, particularly for short-term traders. Forex traders typically use daily pivot points, which are calculated based on the closing prices of the previous day. More specifically, they use the closing prices of the New York market time (4:00 pm EST).
Here is an example of daily pivot points along with the support and resistance levels of GBP/USD on a 1-hour chart:
You can calculate pivot point by using the following formula:
Pivot Point = High + Low + Close / 3
You can then draw the accompanying support and resistance levels with the formula below:
- Resistance 1 (R1) = (2 x Pivot Point) - Low
- Support 1 (S1) = (2 x Pivot Point) - High
- Resistance 2 (R2) = Pivot Point + (High - Low)
- Support 2 (S2) = Pivot Point - (High - Low)
- Resistance 3 (R3) = High + 2 x (Pivot Point - Low)
- Support 3 (S3) = Low - 2 x (High - Pivot Point)
In reality, you won't need to manually calculate all the levels above. You can simply use custom indicators that could automatically display the pivot points on trading platforms like MetaTrader. If you don't want to use any indicator from a third party, you can use the pivot point calculator.
Pivot points can be calculated daily based on the High and Low of the previous day. You can also count it weekly based on the High and Low of the previous week. In some cases, pivot points can even be calculated monthly. Day traders typically use daily pivot points, whereas swing traders typically make use of daily and weekly pivot points.
How to Measure Pivot Points Accuracy
In order to measure the accuracy of pivot points in the span of x number of days, here's what we can do:
Subtract the actual Low on that day with the support level based on pivot points. You'll get these formulas: Low – S1, Low – S2, and Low – S3.
Subtract the actual High on that day with the resistance level based on the pivot points. You'll get these formulas: High – R1, High – R2, and High – R3.
Find the average value of each result.
If we apply those formulas to the EUR/USD pair from January 1999 to early 2010, then we'll get:
- The average value of the actual Low is 1 pip below Support 1.
- The average value of the actual High is 1 pip below Resistance 1.
- The average value of the actual Low is 53 pips below Support 2.
- The average value of the actual High is 53 pips below Resistance 2.
- The average value of the actual Low is 158 pips below Support 3.
- The average value of the actual High is 159 pips below Resistance 3.
Based on the statistics above, we can conclude that S1 and R1 levels are fairly accurate to measure the actual Low and High. You will be able to figure out the best possible price movements after doing a series of research to determine the accuracy of pivot points on your favorite currency pair.
See Also:
Setting Stop Loss and Take Profit with Pivot Points
In this part, we're going to see the number of trading days when the Low is lower than S1, S2, and S3, as well as the number of trading days when the High is higher than the R1, R2, and R3. The following calculation used the data from the day EUR/USD first traded to the 12th of October in 2006 2026 trading days in total):
- The actual Low has been lower than S1 892 times or equal to 44% of the time.
- The actual High has been higher than Resistance 1 583 times or equal to 42% of the time.
- The actual Low has been lower than S2 342 times or equal to 17% of the time.
- The actual High has been higher than R2 354 times or equal to 17% of the time.
- The actual Low has been lower than S3 63 times or equal to 3% of the time.
- The actual High has been higher than R3 52 times or equal to 3% of the time.
Such information is certainly helpful to help you determine your potential stop loss and take profit levels. Once you figure out that the Low of the currency pair falls below S1 for about 44% of the time, it should be enough for you to place a stop loss below S1. The same concept can be used to determine your take profit order. You would want to place your take profit just below R1 because historically, the High exceeds R1 only 42% of the time.
Even if it feels like the odd is on your side and you are confident with the result, please remember that all of these are only probabilities that are based on past prices. There is no guarantee that such scenarios are definitely going to happen in the future.
Combining Pivot Points with Oscillators
As mentioned, you can combine pivot points with other technical indicators like oscillators, for instance. One of the most popular options is the Relative Strength Index (RSI). Here's an example of how to combine RSI divergence with support and resistance levels.
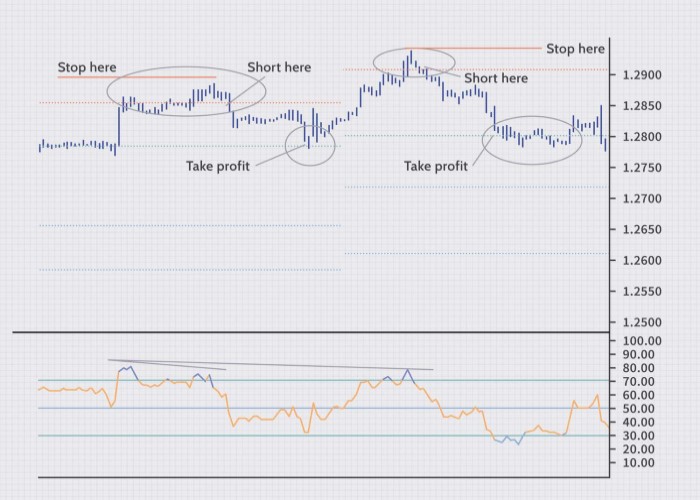
From the chart above, we can see that there was a bearish divergence on the RSI. This suggests that the price might move down from there. You can open a short position after the price breaks through R1 (which was still a support level at the time). Place a stop loss on the previous High and take profit based on the pivot point. In addition, you can apply the same rules for the following day because the RSI divergence was still ongoing.
Did you know? Weekly measurement is considered ideal for a long-term strategy in forex trading. If you're more suitable in using weekly analysis, you might need to learn how to long-term trading the right way.


10 Comments
Carlo Maria
May 26 2022
Can I use pivot points for breakout trading?
Divany
May 27 2022
Carlo Maria: You definitely can! Just keep in mind that pivot points are not permanent, so they might not work every single time.
Shelly
Jun 2 2022
What is the best indicator to combine with pivot points?
Divany
Jun 30 2022
Shelly: When combining technical indicators, you need to make sure that their functions don't overlap. In this case, you could try combining pivot points with Moving Averages and RSI.
Tonny
Jun 10 2022
Is pivot point suitable for long-term traders?
Divany
Jun 30 2022
Tonny: Pivot points are commonly used for intraday traders, but it can also be used in other strategies. For day trading, daily pivots are the most popular, while for swing traders, weekly and monthly pivots are the best option.
Marshall Reszkynsky
Jul 11 2022
What is camarilla pivot point?
Divany
Jul 22 2022
Marshall Reszkynsky: Camarilla pivot point is a refined form of the classic pivot point equations. The indicator is used to calculate intraday support and resistance levels by using the previous days volatility spread.
Armadillo
Jul 13 2022
Can I use pivot points for crypto trading?
Divany
Jul 22 2022
Armadillo: Yes, pivot points are certainly applicable to crypto trading. The level can help us determine the overall market trend of the day and signal potential price reversals or continuation.