Dedicated FREE FOREX VPS
 Free FOREX Virtual Private Server
 MT4 Demo Contest, Get $500
 Sign Up for an Account, Claim 60% Deposit Bonus
 Free MT4/MT5 VPS 2024
 Send E-mail and Get Free Merchandise
 $1K Refer a Friend Bonus for Pepperstone Pro clients
 Maximize Your Earnings with 100% Deposit bonus
 Trade to Win, $5,000 Monthly Demo Contest
 Claim 30% + 15% Deposit Bonus from LiteFinance
The moving average is one of the technical indicators that is commonly used for swing trading. But from the many types and periods of MA, which one is the best?
Among hundreds of different trading strategies on the market, swing trading is one of the most popular. In a nutshell, swing traders gain profit by taking advantage of small to medium market movements. The idea is to identify a changing trend and then ride the new trend for as long as possible until it eventually wears out. In other words, the trader is practically "swinging" from one direction to another as the market trend keeps changing from time to time. This is actually pretty tricky because you may find your profits disappear if you hold for too long. On the other hand, if you close the position too soon, you may miss opportunities to get more significant rewards.

Swing trading can be used in various markets, but it's particularly suitable for a volatile market like foreign exchange. The reason is that it often provides more opportunities for price swings as long as the trader is able to recognize and choose the right signal for trend changes.
Moreover, in swing trading, a wide range of trading tools can be used. Traders typically use technical analysis and indicators to analyze the market, although sometimes they would also use fundamental analysis to support their trading plan. In this article, we will focus on using moving averages as an indicator for swing trading.
Contents
Using Moving Average for Swing Trading
Moving average is perhaps the most popular technical indicator used in many financial markets. Even though the trading tool has been around for a long time, but it's still widely used today due to its simplicity and reliable signals. This makes them an ideal foundation for many modern trading strategies.
Moving averages are primarily used to forecast the direction of a trend and determine support and resistance based on historical data over a specific period. It's called "moving" average simply because it continually recalculates its results based on the latest price data.
There are a few kinds of moving averages, but the two most common ones are Simple Moving Average (SMA) and Exponential Moving Average (EMA). Both essentially show the average of particular asset prices over a predetermined period of time, but the difference between the two indicators lies in the sensitivity. While SMA is not weighted toward any specific point in time, EMA puts a bigger emphasis on more recent data. Thus, EMA tends to be more responsive to recent price changes as compared to SMA which puts equal weight on all changes in the given time.
See Also:
However, it's worth noting that choosing which moving average to use is not as easy as it looks. This can be pretty challenging because the forex market never stays the same as it naturally evolves over time. In fact, most forex trading depends on the market condition and how the trader views the market. And when it comes to swing trading, it's essential to know where the trend is going and when it will change direction to your advantage.
It's possible to just use a typical moving average like 50 SMA to ride the trend, but keep in mind that the strategy might not work every single time. Before you make any decision with your trades, it's crucial to consider important matters such as the market's current condition (breaking, ranging, or trending), the time frame used, and the volatility level of the asset.
Moving Average Strategy for Swing Trading
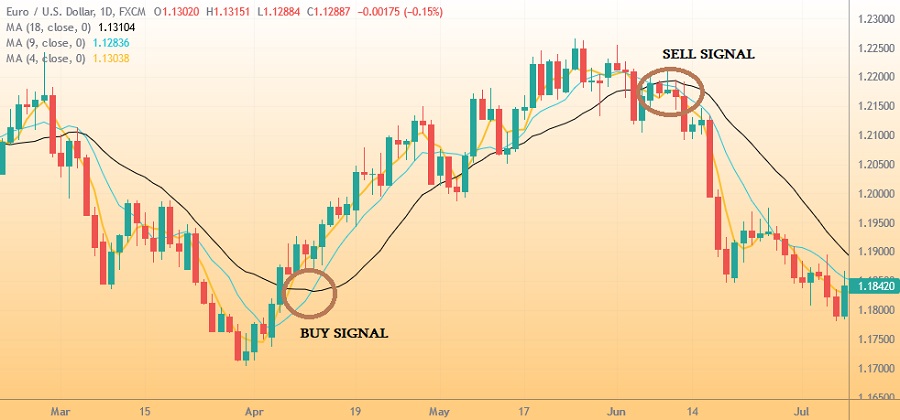
This strategy needs to prepare 3 moving averages on the chart, namely 4 SMA, 9 SMA, and 18 SMA. We're going to use them to identify which direction the market is trending. Remember that short-term moving averages will hug price action more closely than longer ones because they are more focused on recent price changes. Therefore, shorter moving averages will be the first to respond to changes in the price movement.
The strategy that we're going to use is the crossover, so when the MA lines are crossing over, we can interpret this as a buy or sell signal as well as an exit signal. Note that this strategy should be used in conjunction with the overall trend of the market.
Placing an Entry Order
Open a trade order when the 4 SMA crosses over the 9 SMA, and then they both cross over the 18 SMA. If they cross above the 18 SMA, then it's a buy signal. But if they cross below the 18 SMA, then it's a sell signal.
Technically, the sharper the push from the moving averages, the stronger the buy/sell signal is. In contrast, if the price action moves sideways and the 4-period and 8-period moving averages just drift over the 18 SMA, it can be inferred that the signal is weak. That being said, you must always keep an eye on the price to make sure that it remains above/below the 18-period line.
Some aggressive traders might enter the market if they see a strong crossover of the 4 SMA and the 9 SMA lines in anticipation of both crossing the 18-period line. This can be a smart move, but be sure to check if the moving averages are moving in the direction of the break and pay attention to the momentum. If the momentum starts to dwindle early, then it's probably a sign of a weak trend. Aside from that, it would also be helpful to keep an eye on the overall trend by using the medium and long-term time frames. If the market is trending in a specific direction, then you should be ready for retracements in the opposite direction.
See Also:
It's possible to find that the price retraces sharply, which causes the 4 SMA and 9 SMA to cross over the 18 SMA rather quickly. But since it's only a retracement and not part of the whole big trend, the price can get exhausted fast. If the price is losing momentum, it will show first in the short-term SMAs.
Identifying the Exit Signal
This part can be a bit more subjective because traders can choose to exit the trade at different times. We would recommend exiting the trade based on the strength of the trend. You can wait for the moving averages to crossover once more, or you can make your own judgment on when to close the position. However, it's a big warning sign when the 4 SMA and the 9 SMA cross back over the 18 SMA. In this case, you should exit the trade immediately to reduce potential losses.
If the trend is strong, it would be best to exit the trade once the price moves in the opposite direction. Remember that a sharp push in either direction can be subject to retracements.
Stop Loss Settings
Ideally, a stop loss should be placed close enough to minimize losses but also far enough so that it won't be activated too early in the game. This is important especially considering that the price might move in the opposite direction for a little while before moving back to the previous trend direction. If you place the stop loss too close to your entry point, then it might get triggered before the price turns back. Another possible case is when the 4 SMA and 8 SMA cross over the 18-period before a stop is triggered. If this happens, cut your losses immediately.
Brief Summary
We've learned from this article that moving average can be a remarkable technical indicator for swing trading if we know how to use it right. Using this indicator, we can find great entry and exit signals for our trades and determine the strength of the overall trend. However, bear in mind that this trading plan is not the only one since there are plenty of other combinations out there that you can use in swing trading.
To keep the risk low, it's best to combine this strategy with price action or other indicators to confirm the trading signals further. Lastly, you should also note that, like any other trading plan, there is no guarantee that this strategy will always work out. Therefore, always do a backtest in a demo account and make sure that it fits your trading preferences.