 Dedicated FREE FOREX VPS
 Free FOREX Virtual Private Server
 MT4 Demo Contest, Get $500
 Sign Up for an Account, Claim 60% Deposit Bonus
 Free MT4/MT5 VPS 2024
 Send E-mail and Get Free Merchandise
 $1K Refer a Friend Bonus for Pepperstone Pro clients
 Maximize Your Earnings with 100% Deposit bonus
 Trade to Win, $5,000 Monthly Demo Contest
 Claim 30% + 15% Deposit Bonus from LiteFinance
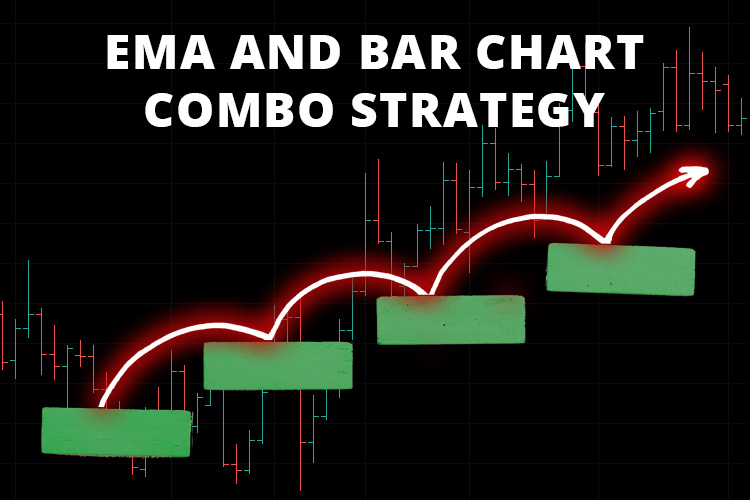
This is a short-term trading method that specifically uses bar charts as opposed to common candlesticks. Let's learn how to combine it with EMA to generate trading signals.
In the world of trading, there are many strategies that can be used to achieve desired profitability. The bounce trading strategy that uses bar charts and Exponential Moving Averages (EMA) is one of them.
Briefly, the bounce trading strategy is a method that uses price bounces. This strategy utilizes the EMA's ability to identify strong dynamic support and resistance levels and combine it with bar charts' simple visual to determine entry and exit points.
Why Use EMA and Bar Charts?
Typically, this technique uses a small time frame and one type of Exponential Moving Average (EMA) to give more weight to recent price movements. EMA does have an advantage over other types of Moving Averages such as Simple Moving Average (SMA) and Weighted Moving Average (WMA). This is because EMA is much more responsive and suitable for various trading techniques, including the bounce strategy.
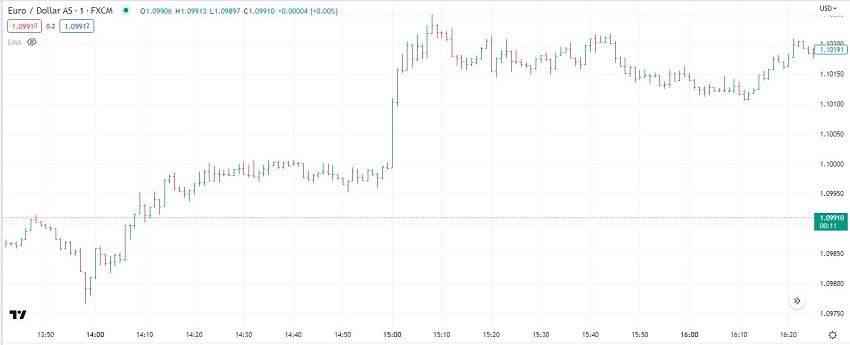
Meanwhile, this strategy uses Bar Charts due to its advantage in presenting a complete price data (OHLC) with simpler visuals. Unlike candlestick charts, bar charts are not filled with bearish and bullish colors, thus allowing traders to focus on the price bounce and capitalize the opportunities easier.
How Does the Bounce Strategy Work?
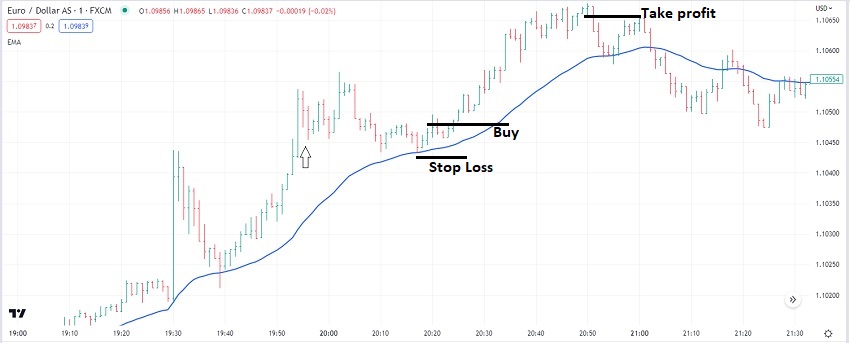
The EMA indicator can help traders show the overall direction and trend of price movements, creating a smoother-looking price line. When the price undergoes a strong movement, the line will jump before continuing its movement in the original direction. The strategy will use this bounce as an opportunity to enter a position.
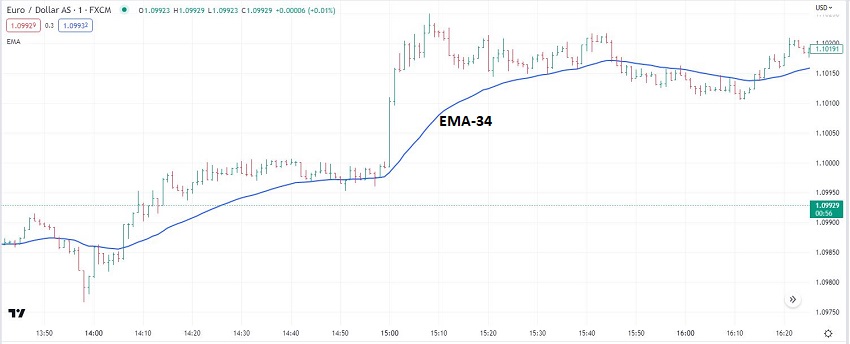
For the basic setup, traders can use a bar chart on a 1-minute to 5-minute time frame and an Exponential Moving Average period of 34 (34 EMA).
Then, what about the target profit?
As reported by The Balance, this strategy can and should be used with an estimated target profit of 10 pips and a stop loss of 5 pips.
1. Open a Bar Chart
2. Add the 34 EMA
3. Observe How the Price Moves around EMA
Wait for the price to move away from the EMA. There is no standard distance that the price must reach, but the farther the better. For this example, the distance used is about 10 pips.
Next, you need to be cautious when the price reverses and starts to move back toward the EMA line.
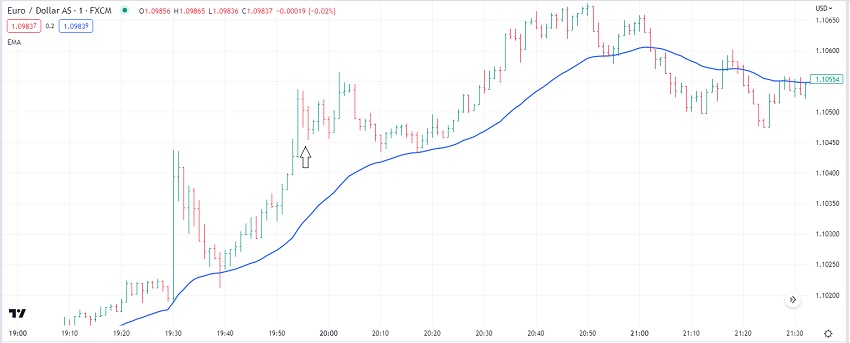
4. Wait for the Price to Touch EMA
To confirm the signal, the price must touch the EMA line before bouncing. For a buy trading scenario, the price bar should have made lower lows when approaching the EMA. Conversely, a sell trading scenario would require the price bar to make higher highs when approaching the EMA.
There is no specific number of bars to measure the lower low and higher high. However, it is highly recommended that traders wait for at least three lower lows and higher highs. The chart below shows that the price only touches the EMA after forming three consecutive lower lows.

5. Set an Entry Trade
To enter a buy position, follow these guidelines:
- Price bars make lower lows.
- A bar touches the EMA line.
- The next price bar fails to make a new low.
- The bar breaks the previous high.
As for sell positions, follow these guidelines:
- Price bars make higher highs.
- A price bar touches the EMA line.
- The next price bar fails to make a new high.
- The bar breaks the previous low.
6. Exit the Trade
The next important step is to determine the exit scenario. Traders could use the bouncing bar's low as the main reference to set a stop loss. For a winning scenario, a risk/reward ratio is needed to place a profit target so traders can maintain good profitability in the future. If you use price action, look over the previous key resistance to determine a good take profit level.
Traders can also utilize a trailing stop if the trend is strong enough to continue further.
Before applying this simple strategy to your real account, it's highly recommended to perform backtest and forward test on a demo account. After all, not all traders could apply the same trading strategy and yield the same success.


5 Comments
Jerremy
May 4 2023
How does the Exponential Moving Average (EMA) differ from other types of Moving Averages, such as the Simple Moving Average (SMA) and Weighted Moving Average (WMA)? I've heard that EMA is known for its responsiveness and suitability for different trading techniques, including the bounce strategy. Could you tell me more about why EMA is considered more responsive and how it provides an advantage over other Moving Averages? It's fascinating to learn about the specific features that make EMA stand out and its potential applications in different trading strategies.
Lidya
Jun 15 2023
@Jerremy: Hey there! Moving Averages are pretty handy tools in trading, and each type has its own characteristics. So, let's dive into the differences between the Exponential Moving Average (EMA), Simple Moving Average (SMA), and Weighted Moving Average (WMA).
The EMA is known for being more responsive compared to SMA and WMA. It achieves this by placing greater weight on recent price data, which makes it react faster to price changes. This can be beneficial for traders who want to capture short-term trends and take advantage of quick market movements.
The advantage of EMA's responsiveness lies in its ability to provide timely signals. It can help traders spot trend reversals or potential entry and exit points more quickly. This makes it suitable for trading strategies like the bounce strategy, where traders aim to profit from price bounces off support or resistance levels. (read : A Trader's Guide to EMA Strategy)
On the other hand, SMA and WMA give equal weight to all data points, which makes them smoother but less responsive to recent price movements. They may be more suitable for longer-term trend analysis or filtering out noise in volatile markets.
Billy Den
Jun 23 2023
What's the big deal with using Bar Charts instead of Candlestick Charts in this strategy? Are there any other sweet perks that come with Bar Charts? I mean, besides giving you the whole shebang of price data (Open, High, Low, Close), what else makes bar charts so cool? Unlike those flashy candlestick charts with their bullish and bearish colors, bar charts keep it simple and let you focus on those sweet price bounces. It's like having a straightforward visual aid to spot opportunities and grab them with ease. So, spill the beans, what other benefits do bar charts bring to the table in this strategy?
Suhyeon
Jun 27 2023
@Billy Den: Hey!! Let me break down to you! Using bar charts instead of candlestick charts in a trading strategy can indeed have its perks. While candlestick charts may have their flashy colors and provide additional visual cues, bar charts offer simplicity and focus on the essentials.
One significant advantage of bar charts is their ability to display the complete price data, including the Open, High, Low, and Close prices. This comprehensive view allows traders to analyze the price action effectively and identify key levels, trends, and patterns without any distractions.
Bar charts also provide a straightforward visual aid for spotting price bounces and reversals. With a quick glance, traders can easily identify support and resistance levels, trend lines, and chart patterns. This simplicity enables traders to make informed trading decisions efficiently and seize opportunities as they arise.
Another benefit of bar charts is their compatibility with various trading strategies. Whether you're a swing trader, day trader, or long-term investor, bar charts can be used across different timeframes and markets. They offer flexibility and adaptability, making them suitable for a wide range of trading styles and preferences.
Antonio
Jun 30 2023
What are the key advantages of using Exponential Moving Average (EMA) over other types of Moving Averages, such as Simple Moving Average (SMA) and Weighted Moving Average (WMA), in trading strategies? I understand that EMA utilizes a smaller time frame and assigns more significance to recent price movements. This characteristic makes it highly responsive and well-suited for different trading techniques, including the bounce strategy.
However, I'm curious to learn more about the specific advantages that EMA offers. How does its responsiveness enhance the accuracy of trading signals and help traders capitalize on market opportunities? Are there any notable differences in the way EMA captures and reflects price trends compared to SMA or WMA? Furthermore, are there any particular trading scenarios or strategies where EMA outperforms other types of Moving Averages?