 Dedicated FREE FOREX VPS
 Free FOREX Virtual Private Server
 MT4 Demo Contest, Get $500
 Sign Up for an Account, Claim 60% Deposit Bonus
 Free MT4/MT5 VPS 2024
 Send E-mail and Get Free Merchandise
 $1K Refer a Friend Bonus for Pepperstone Pro clients
 Maximize Your Earnings with 100% Deposit bonus
 Trade to Win, $5,000 Monthly Demo Contest
 Claim 30% + 15% Deposit Bonus from LiteFinance
Instead of relying on the Moving Average crossover, this day-trading strategy seeks to find buy/sell signals based on price actions around 50 and 200 EMA.
The Moving Average is the best and simplest tool for traders hoping for a short-term profit with a trend-following approach. As one of the most well-known technical indicators in the world, Moving Averages serve as the foundation for numerous trend-following tactics.
For this day-trading strategy, we apply 200 and 50 Exponential Moving Averages (EMAs) on the 4-hour charts. Instead of relying on the Moving Average crossover, we seek to buy/sell right after the trend is detected and exit on a profit right away.
Chart Setup for Day-Trading
The foundation of this day-trading strategy is 200 EMA and 50 EMA that are applied to closing prices on any 4-hour charts. Trends are well-represented in this time frame because the H4 chart interval closely follows the D1 charts.
After setting up the chart, we have to determine the current market bias according to the following criteria:
- When the 50 EMA has just crossed below the 200 EMA, the market tends to go bearish, and we should look to sell.
- When the 50 EMA has just crossed over the 200 EMA, the market is likely to move in favor of the bulls, and we should look to buy.
Following the trend identification, we have to wait for the buy or sell signal to show up.
Signals to Buy and Sell Based on the 50 and 200 EMA
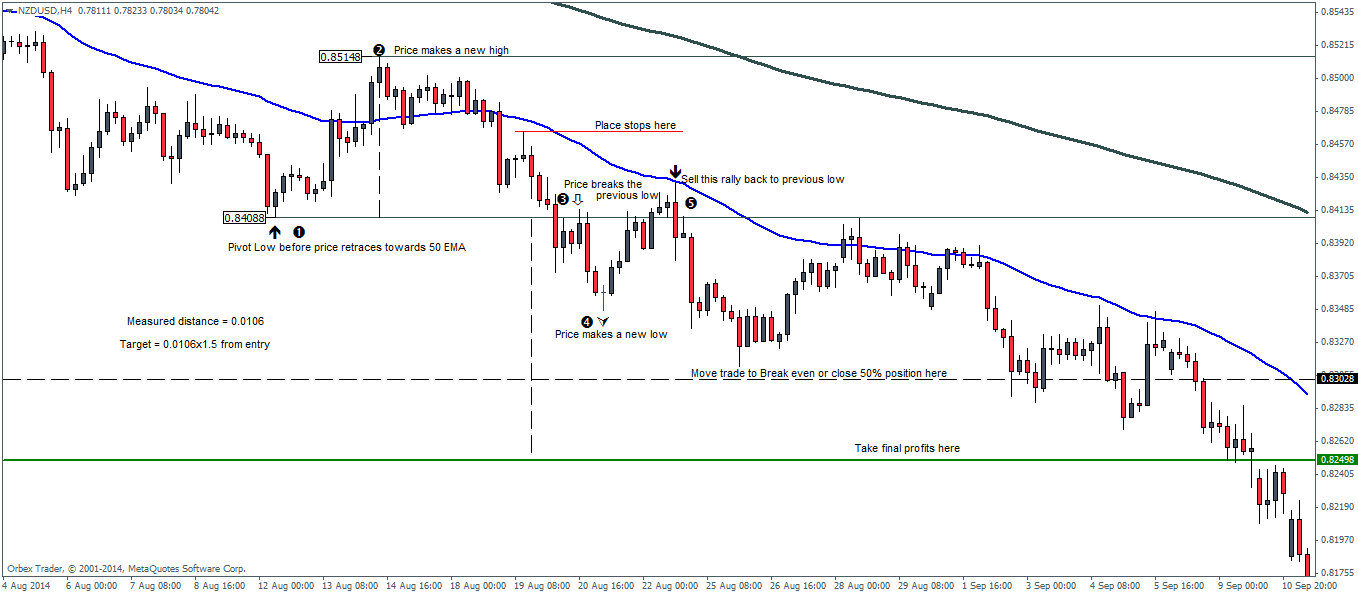
The sell signal must meet the following criteria:
- Prices must be trading at 50 EMA or lower.
- Within the 200 and 50 EMA, prices must first establish a low before retracing to reach a high.
- Mark the low point prior to retracement using the horizontal line tool.
- After this low is broken, wait until a new low is created and prices begin to retrace once more.
- Open a short position at the previous low, with a stop loss order at the most visible high above the low.
- Determine the take profit based on the high-low distance and then multiply it by 1.5 times the entry.
An example of this setup can be seen in the following chart:
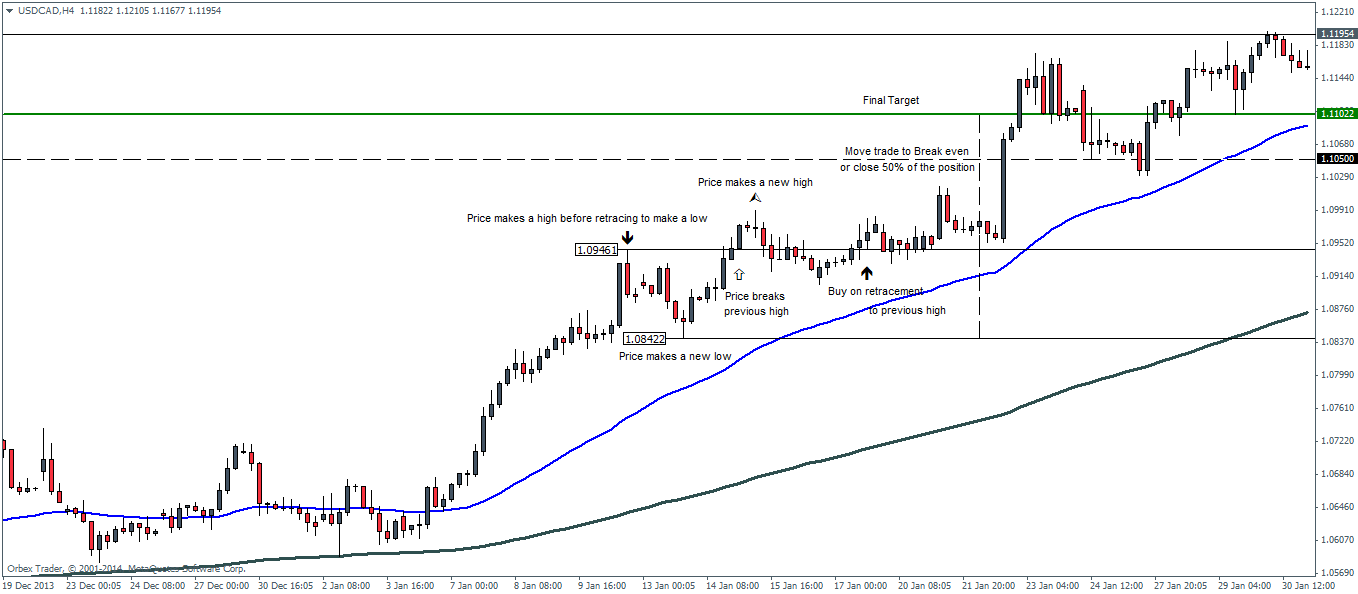
Meanwhile, the buy criteria are as follows:
- Prices must be trading at 50 EMA or higher.
- Within the 200 and 50 EMA, prices must first establish a high before retracing to reach a low.
- Mark the high point prior to retracement using the horizontal line tool.
- After this high is broken, wait until a new high is created and prices begin to retrace once more.
- Open a long position at the previous high, with a stop loss order at the most visible low above the high.
- Determine the take profit based on the high-low distance and then multiply it by 1.5 times the entry.
The Benefits and Drawbacks
There is no infallible trading setup in the world. This day-trading strategy, too, has its own advantages and disadvantages.
There are two drawbacks to employing this trading approach. First, trade set-ups don't happen very often, which may obstruct active traders who seek to gain a daily profit. Second, prices do not always retrace and continue to rise even when all conditions are satisfied. It means a wasted opportunity, but you should still follow the rules instead of arbitrarily opening new trades without proper considerations.
On the other hand, below is the list of benefits you can gain by adopting this trading strategy:
- It is a low-risk trading strategy because you will only enter after the trend has been established.
- Integrated risk management, where each trade has an ideal risk/reward ratio of at least 1:2.
- The average holding period can range from a few days to a week because it is based on the H4 chart.
- Fairly objective day-trading strategy, though finding the right buy/sell signal may take some practice.
So, will you make use of this day-trading strategy?


3 Comments
John Hardi
Dec 20 2022
Jaguar
Jan 14 2024
I'd like to inquire about the article discussing day trading with the 50 and 200 EMA. It mentions the importance of integrated risk management, emphasizing that each trade should ideally have a risk/reward ratio of at least 1:2 to align with this strategy. However, I've come across multiple articles suggesting a similar recommended risk/reward ratio of at least 1:2. What makes this risk/reward ratio significant, considering its widespread use in various contexts?
Fermin Lopez
Jan 18 2024
Let me answer! So, the significance of the 1:2 ratio lies in its ability to provide traders with a favorable risk-return profile. By aiming for a reward that is twice the risk, traders can potentially offset losses with fewer winning trades, maintaining a positive overall outcome. This ratio is not specific to a particular strategy but rather serves as a general guideline in trading. For example, loss $1 but profit $2. You need to profit once for 3 trade.
Its pervasive use across various trading methodologies underscores its perceived effectiveness and practicality. Traders often find comfort in this ratio as it promotes a disciplined approach, encouraging a careful consideration of risk before entering into a trade. In essence, the 1:2 risk/reward ratio is embraced for its ability to align profitability goals with risk tolerance, contributing to a well-rounded and sustainable trading approach.