 Dedicated FREE FOREX VPS
 Free FOREX Virtual Private Server
 MT4 Demo Contest, Get $500
 Sign Up for an Account, Claim 60% Deposit Bonus
 Free MT4/MT5 VPS 2024
 Send E-mail and Get Free Merchandise
 $1K Refer a Friend Bonus for Pepperstone Pro clients
 Maximize Your Earnings with 100% Deposit bonus
 Trade to Win, $5,000 Monthly Demo Contest
 Claim 30% + 15% Deposit Bonus from LiteFinance
The Moving Average is one of the simplest yet powerful tools to trade. Read further to find out which Moving Average is best used for a 15-minute chart.
One of the most critical matters that every trader must have is a trading strategy. Without a proper plan, trading might be tougher than it should be and the results can go unexpectedly. Especially for novice traders, it would be helpful to use a strategy that is simple to execute but powerful enough to gain profits.
You don't always need a super complicated or professional method to find success in trading. Instead, you only need an effective strategy. Utilizing one of the oldest and simplest trading tools called Moving Averages can be a good start. While there are many types of Moving Averages that you can choose, here we will talk about the 20 EMA.
How Does the 20 EMA Strategy Work?
The main advantage of the 20 EMA trading strategy is that it is very easy to follow even for novice traders. The only tool you need is the 20 EMA and it can be used for any currency pairs in any time frame. However, the strategy is best used when the price is moving fast or in other words, when the market is in high volatility.
In a downtrend, the price is expected to go down. But at some point, you will see that the price will change direction to test the 20 EMA line. If the downtrend is strong, then the 20 EMA will be able to push the price back down. This is called a "retest" and it can happen once or a few times before it finally reaches a point where the 20 EMA is broken. So, the 20 EMA strategy basically acts as the bounce line for candlesticks. As a trader, you should wait and make use of the moment where the price retests the 20 EMA line.
You only have to pay attention to one very specific candlestick. It refers to the first candlestick that heads back up and touches the EMA line after the price had been steering away from it for some time. Remember, if the next candlestick still touches the EMA line, then it is not a good signal, so you should look for another one. Once you found the right signal, it would be the right time to open a position.
Here's an example:
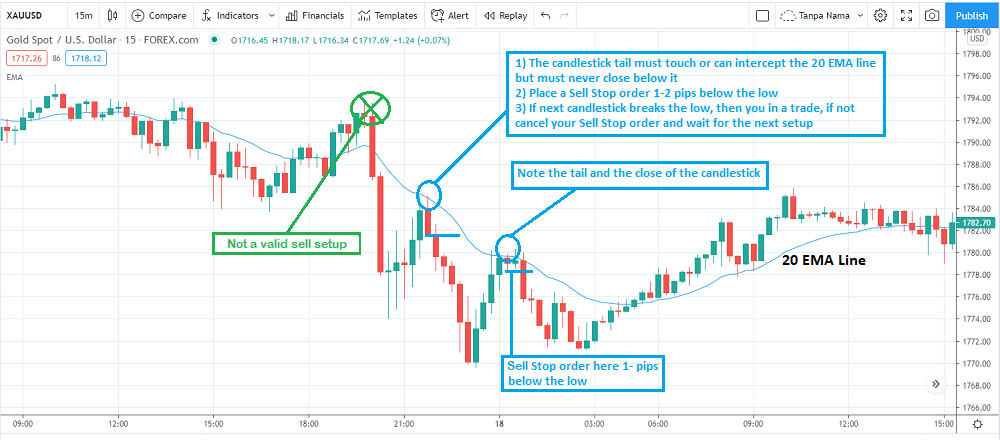
While that explains the setup for a Short position, you can also learn about the Long setup very easily because it is exactly the opposite. The basic principles in the 20 EMA strategy are:
- When the price is closing above the 20 EMA, then it is an uptrend. In comparison, if the price is closing below the 20 EMA, then it is a downtrend.
- The candlestick that first touches the 20 EMA after the trend has changed direction is called the signal candlestick. This is the only thing that you should pay attention to because your entry depends on the signal candlestick's Low and High.
- In an uptrend market, you should place your buy stop pending order at least 1-2 pips above the High of the signal candlestick. If the next candlestick doesn't activate your order, then you should cancel it.
- In contrast, in a downtrend market, place your pending sell stop order 1-2 pips below the signal candlestick's Low. If the next candlestick does not activate the order, you need to cancel that pending order.
- Place your stop loss a few pips (at least 5-10 pips depends on the time frame you use) below the signal candlestick for a buy trade and above the signal candlestick for a sell trade.
20 EMA Trading Strategy for 15-Minute Chart
If you're into scalping or other short-term strategies, making use of a Moving Average in a 15-minute chart is quite recommended. The 20 EMA is the best moving averages to use in the 15-minute charts because the price follows it most accurately during multi-day trends. In other words, you can easily identify the trend from there.
Identify the Major Trend
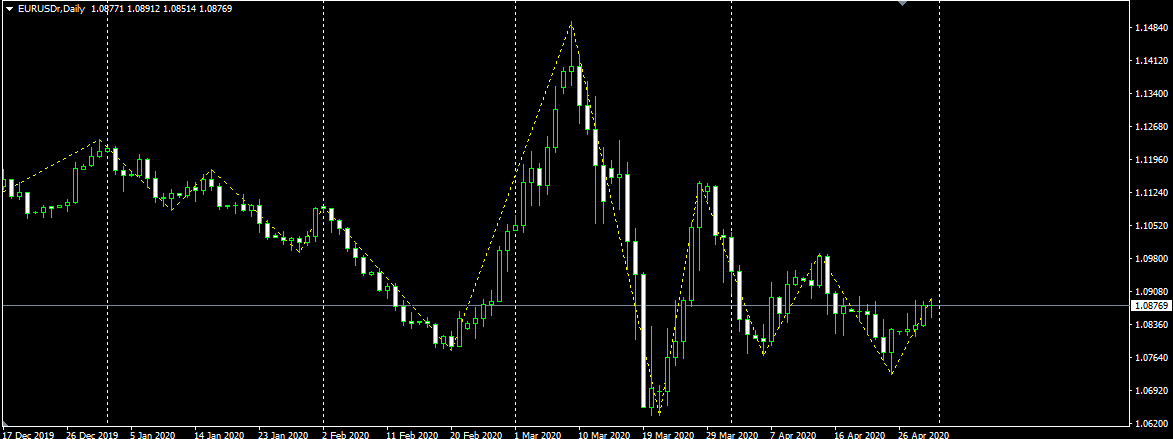
Before you jump into the 15-minute chart, you should know how to identify the trend in the higher timeframe, namely the daily chart. You don't want to enter the market and risk your money while the trend is unclear, right? That is why it is important to identify the trend beforehand and make sure that it is going strong. Once you know the price direction in the daily chart, it would be much easier to find an entry in the 15-minute chart.
First, to identify the trend, you need to set up several rules on the chart. The goal is to recognize where the direction of the price is going to move. Don't worry, these rules can be used for both up and downtrends, and it also works on different time frames:
- Make sure that the price has been moving up for several days with at least one Higher Low for an uptrend and a Lower High for a downtrend.
- The price has a 20 EMA line that is pointing upwards, at a two o'clock angle or steeper for an uptrend, or a four o'clock angle for a downtrend.
- The price has significantly broken a resistance level (in an uptrend) or support level (in a downtrend).
Spotting the Entry Points
After confirming the trend, now it is time to determine your entry position. Shift to the 15-minute chart, and learn that there are two conditions that you should look for as the potential buy spots in an uptrend chart.
The first one would be the breakout over a resistance shown on the daily chart. If it is clear that the price follows the 20 EMA line, it indicates an ideal Long position. The second spot is when there is a big movement over the resistance zone. This condition is considered safer because the price has confirmed its momentum and keeps going in the expected direction. Therefore, as soon as the price hits and holds the 20 EMA, that would be a good entry spot for you.
Is the 20 EMA Ideal for Day Trading?
Yes, it is. Not only for scalping, you can also use 20 EMA for day trading. However, in day trading, you'll typically need a particular pattern before you start your trade and once you find one, make sure to confirm it with the support and resistance levels. The pattern itself is quite easy to recognize.
You should see either a strong down or up movement with a retrace to the 20 EMA within the first 2 hours after the market opened. Keep in mind that to keep the strategy going, you also need to check the trend on the higher time frame. If you recognize that the trend is going in the same direction as the earlier move, there is a big probability that the price will reverse at the 20 EMA.
Can 20 EMA Strategy Fail?
Like every other trading strategy, 20 EMA is not free of flaws and can potentially fail. So there are times when the price does reach a support or resistance level and still goes sideways. The price can also be moving around, completely ignoring the 20 EMA line. If you happen to come across such conditions, it would be better to stop the trade and wait for another opportunity because the market is full of uncertainties in such circumstances.
On the bright side, while it is possible to fail, you can actually increase your chance of success with the 20 EMA strategy. First, you can use several time frames at once to measure the strength of the trend.
For example, you can look for strong price movements on the daily and 1-hour charts, and then open a position when you find a good entry point on the 15-minute chart. Such high probability trade is a lot more profitable than only sticking with one time frame that is already used by many traders worldwide. Other than that, you can also add other tools on the chart and combine them with the Moving Average that you use.
Conclusion
20 EMA trading strategy is a simple yet powerful strategy. Using EMA is considered to be more profitable because it sticks closer to the price compared to SMA. This means it can show a more accurate bouncing line on the chart.
The strategy is easy enough even for novice traders and it is quite effective for short-term trading in a 15-minute chart. Still, don't forget to confirm the trend on the daily chart first and pay attention to the support and resistance zones.
Even if the 20 EMA strategy can still fail at some point, you can increase the chance of winning by using multiple time frames and adding more tools to the chart. Also, the probability of getting profit is still high considering that you are trading in the same direction as the major trend that has been confirmed on the daily chart. It may take a little while to finally get the hang of it, but this simple strategy is definitely worth trying. More importantly, you should try the strategy in a forex demo account before using it in a real account.


5 Comments
Fidel
Nov 21 2023
I find the technical indicator discussion a bit challenging to grasp, but the article does make an effort to shed light on the usefulness of the EMA 20, presenting it as a straightforward approach by focusing solely on the EMA 20 lines and breakout terms. The article emphasizes that our primary consideration should be the breakout under specific conditions. In simpler terms, if it's evident that the price is aligning with the 20 EMA line, it suggests an advantageous Long position. Another crucial aspect is identified when there's a substantial movement beyond the resistance zone, deemed a safer condition as the price has affirmed its momentum and continues in the anticipated direction.
I'm curious, in this context, what does "breakout" exactly mean, and could you explain the significance of the "resistance zone"?
Diego
Nov 23 2023
Memphis
Nov 26 2023
Hey dude, in simple term, you can just imagine like this : resistance zone is where the price has this history of hitting a wall or facing some serious selling vibes. Picture it like a zone below the current price where things get a bit tough. On the flip side, you've got the "support zone" above the price, acting like a safety net where buyers might step in.
So, when you're eyeballing that 20 EMA line and you see a breakout, especially if it goes beyond the resistance zone, it's like the market saying, "Hey, I'm on the move!"—a good heads-up for possible trading opportunities. Hope that clears things up in a more chill way!
Onana
Jan 12 2024
So, the article's saying, "Hold up before you get all cozy with that 15-minute chart. First, you gotta be a trend-spotting pro on the daily chart. You don't want to throw your money into the ring when the trend's doing the cha-cha, right?" So, the deal is to suss out the trend and make sure it's rocking strong before you dive in. Once you've got the lowdown on the daily chart, finding your sweet spot on the 15-minute chart becomes a breeze.
Now, I'm wondering, is it cool to skip the trend-spotting drill on the daily chart and still trade, or is that a risky move?
Zeeland
Jan 16 2024
Is it possible to trade without paying attention to the trend on the daily chart? Well, technically, yes. But it's akin to embarking on a road trip without glancing at the map or checking the weather forecast. Sure, you might luck out, but it's a gamble. The article suggests that, much like putting on your seatbelt for safety, keeping an eye on that daily trend is a precautionary step. It might feel like an extra effort, but it serves a purpose, ensuring your trading journey is smoother and less prone to bumps.
To illustrate, think of it as sailing into the sea without checking the weather – if you're unaware of an incoming storm, your risk of getting into trouble is significantly higher. The article echoes this sentiment, emphasizing the importance of not entering the market and risking your money when the trend is unclear.
Hope it can clear your doubt!