Dedicated FREE FOREX VPS
 Free FOREX Virtual Private Server
 MT4 Demo Contest, Get $500
 Sign Up for an Account, Claim 60% Deposit Bonus
 Free MT4/MT5 VPS 2024
 Send E-mail and Get Free Merchandise
 $1K Refer a Friend Bonus for Pepperstone Pro clients
 Maximize Your Earnings with 100% Deposit bonus
 Trade to Win, $5,000 Monthly Demo Contest
 Claim 30% + 15% Deposit Bonus from LiteFinance
Hammer is one of the most reliable candlestick patterns to use. So what is it and why is it so popular? How to use hammer candlesticks to identify a trading opportunity?
Candlestick patterns are one of the most famous tools to predict the future direction of market movements. It is one of the most vital components in technical analysis, allowing traders to interpret market information quickly and relatively simply. The patterns are typically formed by grouping two or more candlesticks during specific situations. Sometimes, powerful signals can also be given by just one candlestick.
The method was originated in Japan before the West developed the bar charts and point-and-figure charts. In the 1700s, a Japanese man named Homma discovered a link between the price and the supply and demand of rice, and that the emotions of its participants highly influence the market. Since then, the use of candlestick patterns has become more common in various financial markets.
Over time, candlestick patterns have developed to fit in different market conditions. Currently, there are many great patterns that can highlight an opportunity within the market. Among them, the hammer candlestick pattern is one of the most significant.
Identifying Hammer Candlestick Pattern
Hammer candlestick pattern is a type of bullish reversal pattern that indicates a potential price reversal to the upside. It typically appears during a downtrend with strong bearish sentiment and signals that a reversal is going to happen. After the appearance of a hammer, the price will start going up. Hammer candlestick patterns can appear in any time frame.
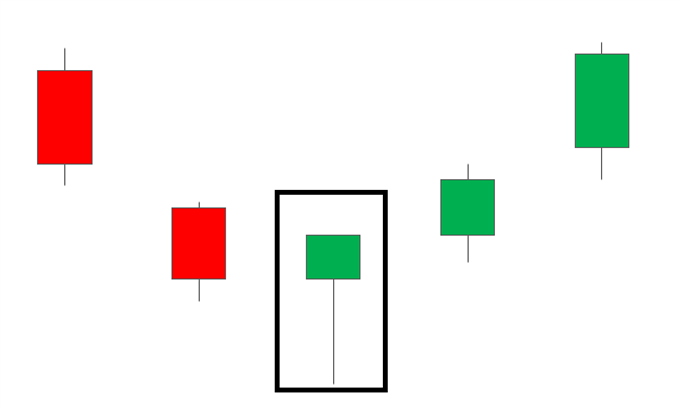
Hammer candlestick has a unique shape. As the name suggests, a bullish hammer candlestick can be recognized by its resemblance to the shape of a hammer. It has a short body with a long lower wick and a much shorter upper wick. The length of the wick determines the quality of the pattern. The lower wick should be at least twice as long as the real body, and the upper wick is supposed to be very short or not visible at all.
A hammer appearance indicates that although the sellers were initially able to push the prices down during the day, ultimately the buyers will be able to overpower the selling pressure and drive the price up. The long lower shadow shows that the seller's strength is weakening, while the short body is due to the closing prices remain near to the opening prices.
However, the formation of a hammer during a downtrend does not necessarily mean you should place a buying order straight away. A bullish hammer candle will only be valid as a reversal signal if it forms at the end of a downtrend. You can use support and resistance in order to anticipate trends that are going to end. Make sure to confirm the signal before making any decisions.
There are at least two common mistakes that traders usually make when it comes to hammer candlestick pattern. First, traders often mistake candlestick patterns as hammers even though the candle either appears in the middle of the trend or at the top of an uptrend. If the hammer-shaped candle appears in the middle of an uptrend, then it is actually a continuation signal of the bullish trend from a pin bar. Meanwhile, if the candle appears at the top of an uptrend, then it is a bearish hanging man reversal signal.
Secondly, traders also confuse a doji candle for a hammer due to their similar structure. Doji candle also has a tiny body, but the candle can indicate that there's indecision in the market since it has both a long lower and upper wick. A doji candle can signal a trend continuation or a price reversal depending on the confirmation that follows. This differs from the hammer candle which occurs in a downtrend, signals a potential upside reversal, and only has a long lower wick.
Inverted Hammer Pattern
The inverted hammer pattern also signals a bullish reversal. The candle, as the name suggests, looks like an inverted hammer. The candle has a long wick, also referred to as shadow, and a small real body like the regular hammer pattern, but the body is at the bottom. So it has a long upper wick, a small body, and a short or non-existent lower wick.
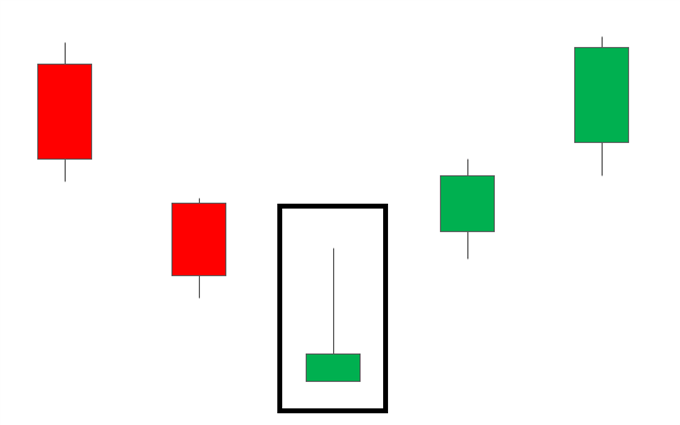
The long upper wick shows that the buyers have tried to change the direction of the price to go upwards during the formation of the candle, but the prices declined due to selling pressure closing near the opening price. It resulted in the form of a bullish signal. If the buying momentum continues, the price will go in the opposite direction and move upwards.
Sometimes, traders confuse the inverted hammer with the shooting star candle. While the two are similar in appearance, they are actually different in several aspects. Unlike the inverted hammer that signals a bullish reversal, a shooting star indicates a bearish signal and typically appears at the top of an uptrend.
See also: Real-time Candlestick Patterns
What the Hammer Candlestick Patterns Can Tell You
Hammer candlesticks are formed after the market has been declining for a while. It indicates that the market is trying to create a bottom. When a hammer appears, it shows that the bears are beginning to lose control over the market, so there's a potential reversal to an uptrend. It's worth noting that this pattern should be formed after three or more falling candles to make it more reliable.
A hammer candle is supposed to look similar to a "T" in appearance. If the candle has a high and closing price close to each other, it is considered a strong bullish pattern because the bulls are able to not just fight off the bears but also push the price higher than the opening price. A candle is also considered bullish if the opening and high prices are the same lengths, but it's not as strong because the bulls could not push the price higher despite being able to negate the influence of the bears.
However, remember that a hammer candle alone does not always indicate a price reversal until it is confirmed. Confirmation occurs if the next candle after the hammer closes above the closing price of the hammer. This generally indicates a strong buying behavior. Apart from that, it's also a great idea to use technical indicators or trend analysis to further confirm the reversal signal.
Trading with Hammer Candlestick Pattern
Before learning how to trade with hammer candlestick pattern, make sure to check the following things:
- Use the daily time frame. If you're a novice trader, it is recommended to use the daily time frame in order to avoid getting fake signals. Once you master the strategy, you can start using lower time frames.
- Pay attention to support and resistance levels. We have mentioned that support and resistance levels are important to anticipate a near-ending trend. You can determine the levels either by doing it manually or use indicators such as pivot points or Fibonacci retracements.
- Stay updated with news releases. Unexpected price spikes might occur during high-impact news releases. So as a precaution, you can use tools like a forex calendar that provides information about upcoming economic events that might affect the price.
See Also:
How to Trade with Hammer Patterns
The chart below shows the ideal condition for a hammer pattern to form. We can see that it starts with the price gradually declining, indicated by several bearish candles formed. At some point, a hammer candlestick pattern is identified. The pattern has a long shadow that is multiple times longer than the real body, which indicates that the pattern is quite strong. Finally, the next candle closes above the hammer, confirming the formation of the pattern.
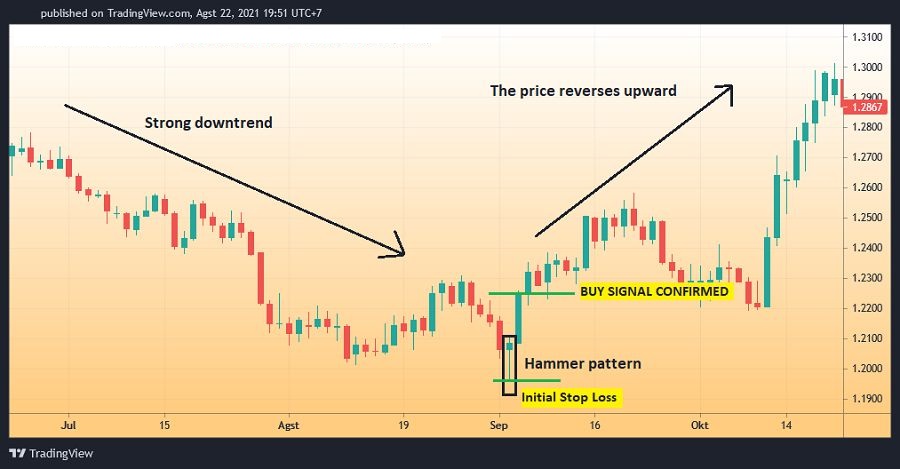
Traders generally step in and open a buy order during the confirmation or close their sell orders during or after the confirmation occurs. For those opening new long positions, a stop loss can be placed at the bottom of the hammer. If the price keeps moving upwards and much higher than the confirmation candle, the stop loss can be set below the real body of the hammer.
Conclusion
The hammer candlestick pattern is often seen as one of the most reliable indicators in candlestick charting, especially when it appears at the bottom of a strong bearish trend. Following the formation of a hammer candlestick, many buyers may search for an opportunity to enter the market. In contrast, those holding short-sell positions may look forward to close their current positions.
However, keep in mind that trading with hammer patterns is still not 100% guaranteed to make you gain profit, even after a confirmation candle is formed. Also, hammer patterns don't provide a price target, so it can be hard to determine the ideal profit for the trade. Therefore, it's not wise to solely rely on the candlestick pattern. Instead, you can use other tools and indicators to confirm the signal accuracy further.