 Dedicated FREE FOREX VPS
 Free FOREX Virtual Private Server
 MT4 Demo Contest, Get $500
 Sign Up for an Account, Claim 60% Deposit Bonus
 Free MT4/MT5 VPS 2024
 Send E-mail and Get Free Merchandise
 $1K Refer a Friend Bonus for Pepperstone Pro clients
 Maximize Your Earnings with 100% Deposit bonus
 Trade to Win, $5,000 Monthly Demo Contest
 Claim 30% + 15% Deposit Bonus from LiteFinance
Memorizing hundreds of candlestick patterns can be a hustle for any trader. Is there a better way of understanding price action? Find out the answer in this article.
In order to gain more profits, many traders are willing to learn various trading techniques. One of the most popular concepts is called price action trading. As such, a trader who knows how to use price action correctly has a bigger potential to improve their trading performance.
Price action refers to a trading technique where traders analyze the chart and make subjective decisions based on past price movements. As most traders nowadays use candlestick charts for their technical analysis, learning their patterns could be the key to master price action.
In general, there are 4 main ideas for mastering price action with candlestick analysis:
- See the bigger picture.
- Learn the four basic elements of a candlestick.
- Use candlesticks to identify market trends
- Different broker, (could be) different candlestick.
Each point above would be explained further in the next section. But before that, let's learn how exactly candlestick relates to price action strategy.

Contents
- Why Is Candlestick So Important in Price Action Strategy?
- 4 Keys to Master Price Action with Candlestick
- Conclusion
Why Is Candlestick So Important in Price Action Strategy?
There are a number of reasons why candlestick analysis could significantly improve your price action strategy:
- Candlestick is one of the mainly used charts by traders around the globe.
- The concept of candlestick fits the idea of price action analysis, in which traders are only required to read the charts and how the price moves without having to utilize any additional indicators.
- A candlestick's parts could identify the market situation, whether the buyers are stronger than the sellers, or how the market decides to close the price at the end of each trading session.
- Traders could determine their next logical action just by understanding a single candlestick formation.
4 Keys to Master Price Action with Candlestick
Before we start entering the forex market and dive into the details of candlestick analysis, we must have the right perspective first. Basically, the price movements occur because there's a "war" between buyers and sellers.
In fact, the four elements (Open, High, Low, Close) in each candlestick tell us a story about the war. Each bar represents a specific duration where the price has moved, starting from the Open until the Close. The goal of each story is to show you who is the winner that controls the market, who is retreating, and which side has a better chance of winning the next battle.
1. See the Bigger Picture
Sometimes, we notice that there is more than one bar grouped together, which then could make it easier for you to collect clues and see the story from a bigger perspective. In other words, the more group of candlesticks formed together, the more complete the story will be.
That is why candlesticks should not be observed in just a single pattern since we can't understand the price dynamics in advance. There are several questions that you should ask when comparing a candlestick to the previous one:
- Is the current candlestick smaller or bigger than the previous one?
- What does the size change mean?
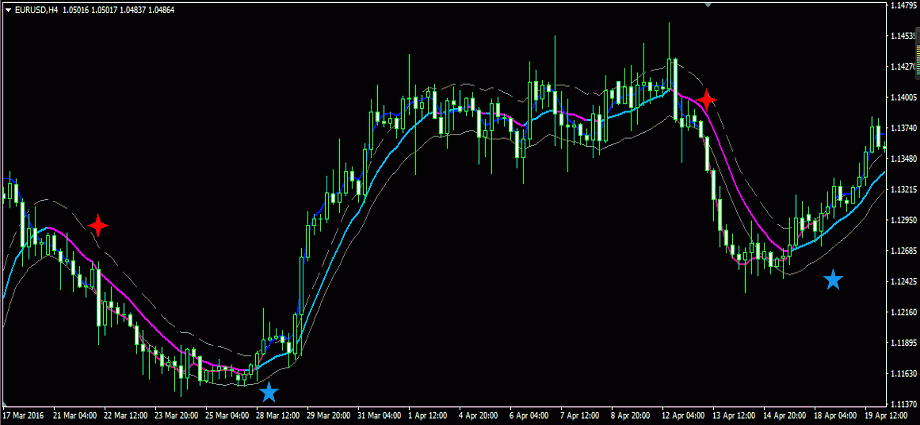
- Does the change occur when the trading session is inactive? For instance, candlesticks on EUR currency pairs often shrink in the Asian session because the trading volume is relatively small.
To answer the questions, let's get on to the next part.
2. The Four Basic Elements of a Candlestick
To grasp the idea behind a candlestick formation, there are 4 basic elements that you must first learn. If you get these aspects correctly, understanding any type of candlestick pattern would be as easy as ABC.
A. Candlestick Body Size
A single candlestick basically shows the market's open, high, low, and close price of the day. Each candlestick has a wide part, which is called the "real body". Looking at the size of the candlestick body is a great starting point in reading candlesticks because we can get a lot of helpful information from it. There are several key findings to remember:
- The length of the candlestick body shows the strength of the price.
- Longer body size typically shows that the momentum is increasing and the price movement is strong.
- When the body shrinks, the momentum is slowing down.
In short, the length of the candlestick body shows how far the price has moved within the duration or time frame of the candle.
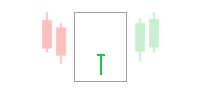
B. The Wick of the Candle
Just above and under the real body are the shadows or wicks. The length of the candlestick wick shows the volatility of price movements in forex trading. The long wick indicates that the price moved fast within the duration of the candlestick, but was resisted due to support or resistance. If the wick gets longer, it means that the volatility is increasing. This often occurs at the end of a trend, prior to price reverses, or when prices approach essential support and resistance.
C. The Ratio of the Body and the Wick
From this point on, we can see a bigger picture in reading candlesticks. Ask yourself the following question: Which is longer, the body or the wick of the candlestick?
During a trend with strong momentum, you will often find long bodies with smaller wicks. It shows that the price is strong. But when the market trend is not supported by strong momentum, the candlestick body tends to shrink while the wick is longer.
D. The Position of the Candlestick Body
This element is the combination of the previous elements.
- If you find a long wick with the body stuck at one end, then that means there is a support or resistance.
- If the position of the body is in the middle of the lower and upper wick, then it shows that buyers and sellers are equal and the market is in a waiting mode to see which side would topple off the other.
3. Read Candlestick Charts to Understand Market Trends
After knowing the four elements above, we can basically "read" the candlestick without having to actually memorize each formation. Now the next question is, how to utilize this knowledge for your trade?
#1 Example: When the Market Trend Reverses
Based on the chart below, there are several things that we can gather:
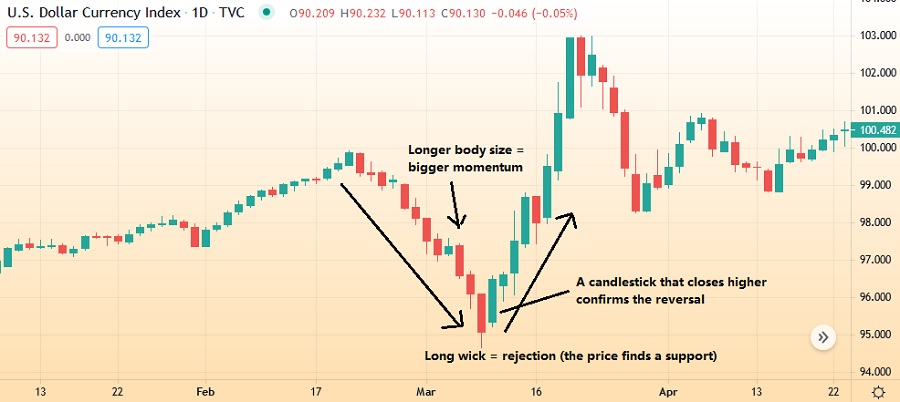
- During a downtrend, candlesticks are displayed in long red bodies with small or no wicks at all. This means that the bearish trend is still strong.
- When it reaches the bottom, we can see that there's a support coming in. However, one candle is not enough to confirm a full reverse signal just yet. The reversal can only be confirmed when the price closes higher than the opening of the candle.
#2 Example: When the Trend Moves Sideways
The next example is a bit different as it shows a sideways market condition. Here are the key findings based on the chart:
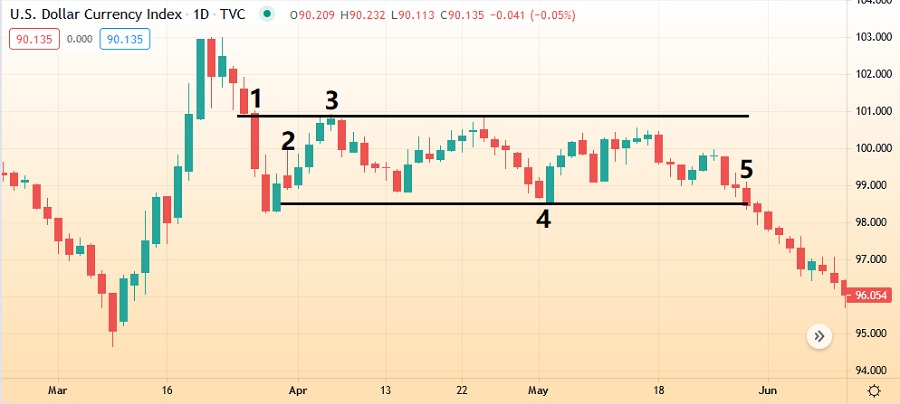
- The price is plunging down on the left side with a series of strong bearish candles and not a single bullish candle among them.
- Next, the length of the candlestick's body starts to shrink and the wick is getting longer. This means that the momentum is weakening.
- The price returned to the previous support point, which now becomes the resistance. Candlesticks show resistance at this point.
- When the price approaches the support point, the candlestick would be quickly followed by a reversal pattern. This shows that the market balance is about equal, so it is unlikely that the price will break out of support just yet.
- Before the price plunges through support, the price appears to form a bearish candlestick line, which means that there's going to be a downward momentum coming.
See Also:
4. Understand that Candlestick Formations May Be Different in Each Broker
Candlestick analysis is mostly built up from subjective predictions of each trader, so the result is not universal. In fact, what a trader sees on his chart may not be the same as what another trader would see, especially if they are trading at a different broker.
Keep in mind that this is totally normal as long as the discrepancy is not too contrast. It doesn't necessarily mean that one of the brokers is providing a false or less accurate chart than the other. Such condition is generally caused by the differences between the brokers' server time. A broker with earlier server time would precede other brokers in the candlestick formation. Still, you need to be careful if the difference is so significant that it can eventually affect your trading outcomes.
Conclusion
The purpose of this article is to show you how to master price action just by learning the basic elements of candlesticks and how to read them.
Reading candlestick charts is not just about knowing the formations. In reality, memorizing hundreds of candlestick patterns doesn't make a significant difference to your trading performance. Remembering all of the patterns can be too much for such a simple strategy and it's impractical, especially for beginners.
Instead, you should just understand the basic concept of how to read candlesticks because each of them basically tells you a lot, including the price structure, the strength of the trend, the dynamics between buyers and sellers, and the projected direction that the price will move next.
By knowing the vital elements of a candlestick, you will be able to see the bigger picture and analyze the chart accurately in any circumstance.
Despite the notion that memorizing candlestick patterns doesn't really matter, there are still some formations that are considered important by most traders. What are they? Learn more in 5 Most Important Candlestick Patterns for High Profits


2 Comments
John
Nov 23 2023
The article mentions that Candlestick analysis relies heavily on the subjective interpretations of individual traders, leading to results that are not universally applicable. In essence, what one trader observes on their chart may differ from another trader's perspective, particularly if they are using different brokers.
Given the diverse perspectives in candlestick analysis, the question arises: How can we enhance the accuracy of predictions? In a scenario where traders have varying viewpoints, achieving consistent profits and learning in a more uniform manner becomes a challenge.
Peter
Nov 28 2023
In my opinion, the accuracy of predictions in candlestick analysis can be enhanced by incorporating additional tools and methods that offer a more objective assessment of market conditions. While candlestick patterns provide valuable insights, it's crucial to complement them with other technical indicators, fundamental analysis, and risk management strategies. (read :A Useful Guide to Combine Candlesticks with Indicators )
To achieve more consistent profits and learning, traders should aim to diversify their analytical approach. This involves considering a combination of indicators and market factors to make informed decisions. Additionally, continuous learning, staying updated on market news, and adapting to changing market conditions contribute to a more well-rounded trading strategy.