 Dedicated FREE FOREX VPS
 Free FOREX Virtual Private Server
 MT4 Demo Contest, Get $500
 Sign Up for an Account, Claim 60% Deposit Bonus
 Free MT4/MT5 VPS 2024
 Send E-mail and Get Free Merchandise
 $1K Refer a Friend Bonus for Pepperstone Pro clients
 Maximize Your Earnings with 100% Deposit bonus
 Trade to Win, $5,000 Monthly Demo Contest
 Claim 30% + 15% Deposit Bonus from LiteFinance
Here is the best indicator setup for 1-hour chart. Renowned among traders worldwide, you can apply them either separately or together.
There are lots of ways to successfully trade the 1-hour chart. A responsive trading platform, good money management, and many more. However, employing the best indicator setup for 1-hour chart is the first step any trader should take.
The best indicator for 1-hour chart is actually the indicator that best fits our trading style, and we have too many options to choose from. Some professional traders take the time and energy to create their own holy grail indicator. Most retail traders, though, prefer to use the ready-to-use technical indicators provided in their own trading platform.
Looking for the best by yourself might be time-consuming, as trading platforms usually come with dozens of technical indicators. So, here are the two best indicators for a 1-hour chart that you can apply either separately or together.
1. 20-period Moving Average (MA)
Anyone who has examined a price chart is aware of how drastically prices may change. By using the average price over a number of periods consecutively, Moving Averages strive to smooth out this wild price movement. The outcome is a smooth line that is overlaid on your chart and follows the candlesticks as shown below.
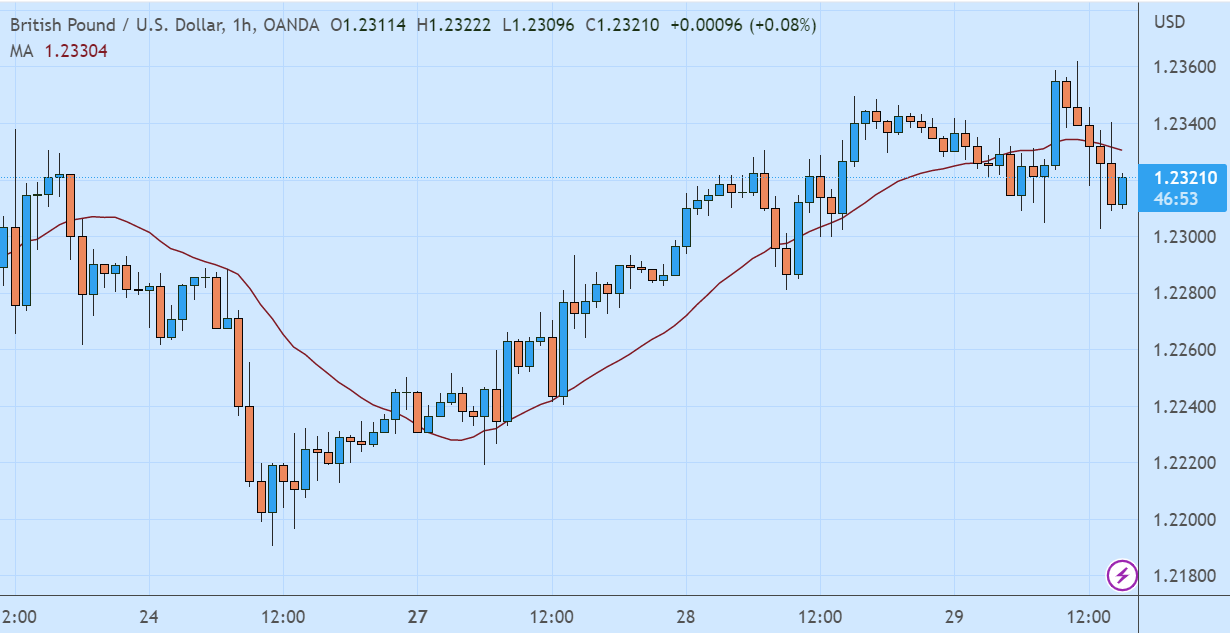
The smoothed line helps identify the market trend when using Moving Averages. If the line slopes upward, it is an uptrend. If the line slopes downward, the price is in a downtrend. As such, you can start to buy when the candlestick chart starts to rise above the line; or sell when the candlestick chart crosses the line downward.
We can also apply two or more Moving Averages on the same chart. In that case, we can seek trading opportunities by looking for crossovers between two or more Moving Averages. Learn more about MA crossovers for intraday trading here.
2. Relative Strength Index (RSI) with Periods of 11
Relative Strength Index (RSI) is an oscillator that swings between 0 and 100. It shows up as a line chart in the subwindow under the price chart. See the indicator below.
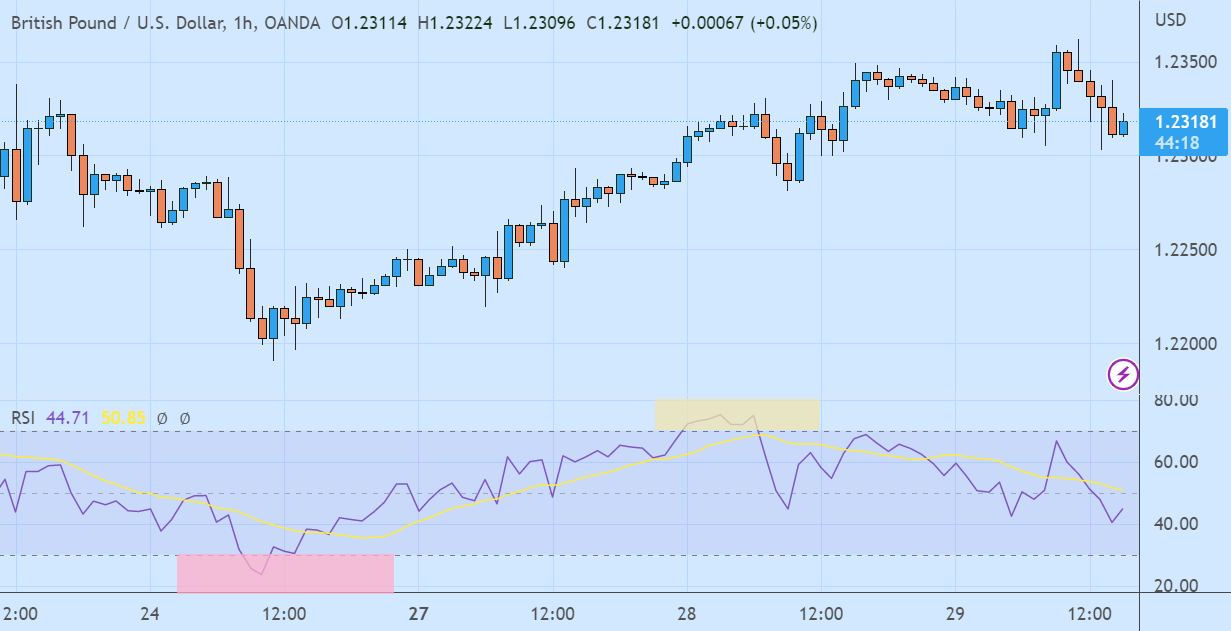
RSI is commonly applied to seek trading opportunities by identifying overbought and oversold areas. The overbought area lies beyond 70, while oversold lies below 30.
When the RSI rises above 70, it signals an overbought condition (yellow area). You can sell the asset once it starts to fall back below 70.
When the RSI falls below 30, it signals an oversold condition (pink area). You can buy the asset when it starts to climb above 30 again.
Another way to use RSI is to identify divergence. This one is a little bit trickier and you would need more experience to find it. Learn more about how to trade using divergence here.
Putting It All Together
Moving Averages aid in the detection of trends and trend reversals. Meanwhile, RSI indicates the momentum of price movements; when the momentum strengthens and slows. They work well together because of their different purposes. See the example below.
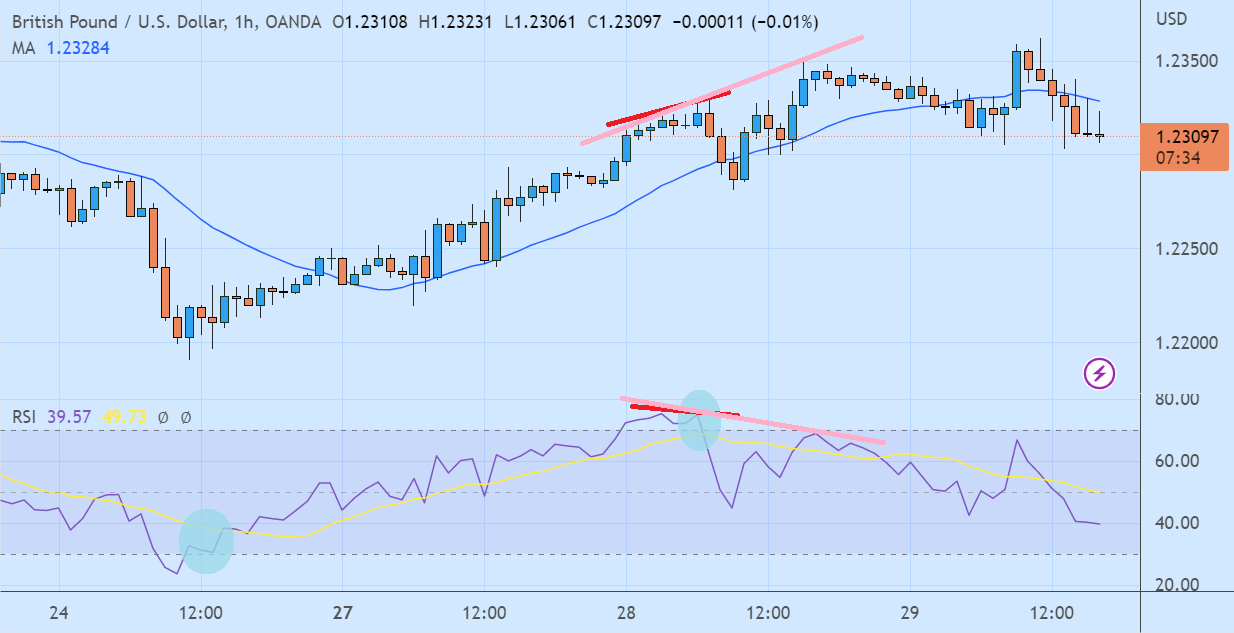
For example, a conservative trader may hesitate to buy GBP/USD when the RSI moves upward in the first blue circle. This is quite reasonable because RSI often produces false signals. However, there is no reason not to buy when you see that candlesticks have crossed the MA line upwards as well in the next few hours.
In the second blue circle, the RSI shows a sell signal as it falls below 70. Along with it, there is a divergence (see the bright red lines on the screenshot). Candlesticks form a new higher high, while RSI falls to a lower high. It means that the GBP/USD rally is losing momentum. Although MA has not shown any signal at that point, the time is prime to enter a short position.
Candlesticks then come back up above the MA line in the next few hours. At that point, you should close your short position. Few profits, but it is better than being hit by an unexpected reversal.
Subsequent developments show that it is not a reversal; instead, a new divergence emerges (pink lines). Candlesticks rise to a new higher high as RSI moves lower. Do not buy in such a situation; instead, seek a new opportunity to sell.
One of the most problematic drawbacks when trading with indicators is the false signals. For Moving Average, we have discussed this particular matter in Are Moving Average Fakeouts Tradable?


6 Comments
Josh
Jun 8 2023
When it comes to analyzing price charts and reducing the impact of wild price movements, the 20-period Moving Average (MA) is often used. However, I'm curious about its applicability in different time frames. While the smoothing effect of Moving Averages is beneficial, I've typically seen them used on longer time frames like daily or weekly charts. So, my question is, can the 20-period Moving Average be effectively applied to a 15-minute chart? Does it provide meaningful insights and help identify trends or support and resistance levels within such a short time frame? I'd love to hear your perspective on using Moving Averages in shorter time frames and their potential impact on trading decisions. Thank you!
Leon
Jun 15 2023
@Josh: Here's the lowdown. Shorter time frames can be wild and noisy, making it trickier to rely solely on Moving Averages. But fear not! The 20-period MA can still dish out some insights. It can help you spot short-term trends, support and resistance levels, and maybe even entry and exit points. (read: Moving Average: The Essential Tool for Trading)
Now, here's the kicker. You can't treat the MA like a fortune-telling guru. It's just one tool in your trading toolbox. To get the most bang for your buck on shorter time frames, consider teaming up the 20-period MA with other indicators. Throw in some shorter-period MAs, candlestick patterns, or even momentum indicators for extra confirmation.
At the end of the day, whether the 20-period MA jives with your 15-minute groove depends on your style and strategy. Give it a whirl, mix it up, and see if it becomes your trusty sidekick. Happy trading, amigo! May the pips be forever in your favor!
Christopher Ezuoke
Jun 21 2023
The strategy looks nice and I look forward to trying it out demo as a fresher. It looks like the RSI has another indicator on it, the yellow line on the RSI window, what indicator is that? Thanks, looling forward to your response.
George
Jun 22 2023
@Christopher Ezuoke: Regarding the yellow line you noticed on the RSI window, that additional indicator is called the "Signal Line." The Signal Line is often used in conjunction with the RSI (Relative Strength Index) to provide further insights into potential buying or selling opportunities. It helps traders identify potential trend reversals or confirm the strength of the existing trend indicated by the RSI. By paying attention to the interaction between the RSI and the Signal Line, traders can gain additional information to make more informed trading decisions. So, when you try out the strategy on a demo account, keep an eye on how the RSI and the Signal Line work together to enhance your understanding of the market dynamics. Good luck, and I hope you find success with your trading endeavors!
Johny
Jun 26 2023
How can the candlestick patterns on a price chart be used in conjunction with the Relative Strength Index (RSI) to enhance trading analysis? In YouTube videos and other educational content, do traders often discuss the correlation between candlestick patterns and RSI signals? How can combining these two indicators help traders identify potential entry or exit points in the market? Are there any specific candlestick patterns that traders commonly associate with overbought or oversold conditions as indicated by the RSI? How does understanding this connection contribute to a more comprehensive trading strategy? Thank you!
Sandy
Jul 6 2023
@Johny: Hey, great questions! So, when it comes to using candlestick patterns and the RSI together, it's like a dynamic duo for trading analysis. You'll find plenty of traders discussing this combo in YouTube videos and educational content. Basically, candlestick patterns give you visual clues about market sentiment and potential reversals, while the RSI tells you if things are getting overbought or oversold. When you combine these indicators, it's like having a double confirmation system.
For example, if you spot a bullish candlestick pattern like a hammer or engulfing pattern, and at the same time, the RSI is in oversold territory, it could signal a potential buying opportunity. On the flip side, if you see a bearish pattern like a shooting star or bearish engulfing, and the RSI is in overbought territory, it might be a sign to consider selling.
Understanding the connection between candlestick patterns and RSI signals helps you make more informed trading decisions. It's like having an extra layer of confirmation for your strategy. So, keep an eye out for those patterns and RSI levels, and it can definitely enhance your trading game. Good luck out there!