 Dedicated FREE FOREX VPS
 Free FOREX Virtual Private Server
 MT4 Demo Contest, Get $500
 Sign Up for an Account, Claim 60% Deposit Bonus
 Free MT4/MT5 VPS 2024
 Send E-mail and Get Free Merchandise
 $1K Refer a Friend Bonus for Pepperstone Pro clients
 Maximize Your Earnings with 100% Deposit bonus
 Trade to Win, $5,000 Monthly Demo Contest
 Claim 30% + 15% Deposit Bonus from LiteFinance
When you read forex analysis, you might come across sentences such as "the chart is quite positive with Goldern Cross" or "the price is still in bullish, but you must be aware of the Death Cross". What is the Golden Cross and the Death Cross? Are they important?
There are lots of trading strategies that can be chosen when hunting for profit. From simply taking advantage of candlestick patterns to a more challenging method like using indicator combinations, traders can choose whatever suits their style.
If you are a fan of technical indicators, you must already know the Moving Average indicator. This indicator is known as the simplest tool on the chart and available on almost all trading platforms. Generally, the Moving Average indicator consists of 3 types: SMA (Simple Moving Average), EMA (Exponential Moving Average), and WMA (Weighted Moving Average).
Although it consists of various types, the main function of the MA indicator is to detect the direction of the trend as well as to determine the entry point of the crossing between two MA lines with different periods. The crossing is a term used to express the intersection between two MA indicators, as well as informing the exact entry point. It is because the crossing tends to show an indication of a reversal, which is an opportunity that can be optimized to look for a profit chance. The occurrence of a crossing between two MA indicators is also referred to as a Golden Cross or a Death Cross. What are they and in what condition do the terms can be applied?
Golden Cross
Golden Cross is a bullish breakout pattern that is formed from the crossing between a low period Moving Average and a higher period Moving Average. The moment of the Golden Cross indicates that a bullish market is in sight. An example of a Golden Cross is when a 15-day MA moves across a 50-day MA from below.
Although the Golden Cross may occur in any Moving Average period, several combinations are most commonly used:
- The combination of the 50-day MA and 200-day MA is popular, especially as an indicator for a bullish breakout in the stock market.
- Day traders usually use a shorter period, such as the combination of 5-day MA and 15-day MA to detect an intraday Golden Cross breakout. The time frame used can range from minutes to daily.
- The MACD Golden Cross is often considered better for assessing the price movements of a particular asset than Moving Average crossings.
In using the Golden Cross, there are 3 things to note:
- Golden Cross accompanied by a high trading volume will strengthen the bullish signal.
- The bigger the time frame, the stronger and more durable the Golden Cross signal. In other words, the signals that formed from the combination of 50-day MA and 200-day MA are considered to be better than the intraday combination of 5-day MA and 15-day MA.
- In short-term trading, the Golden Cross signal on the Moving Average is often used with an Oscillator. With the help of an oscillator, you will be able to track the price momentum more closely and get the exact moment when the uptrend is overbought or when the downtrend has reached the oversold point.
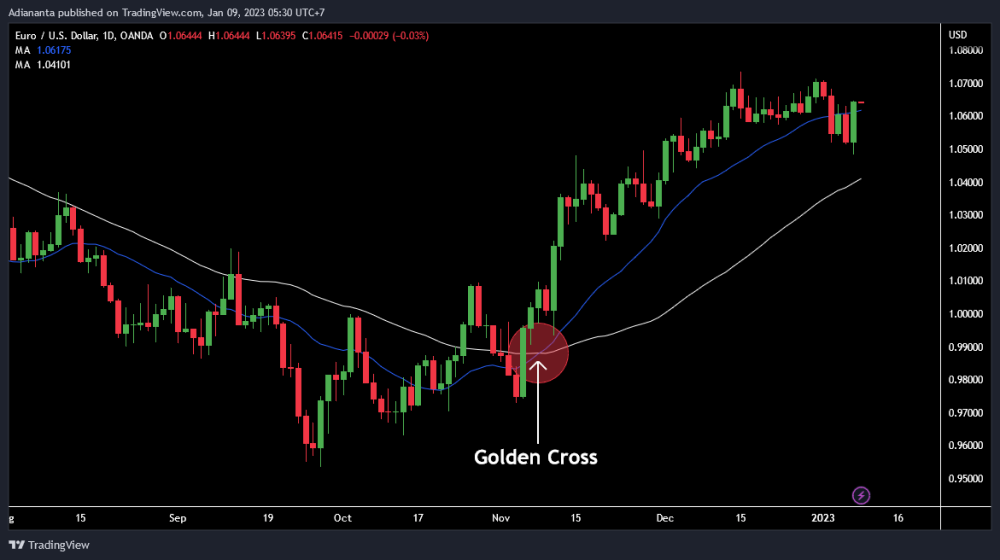
On the EUR/USD chart below, you can see a Golden Cross between a 50-day MA and a 200-day MA:
 See Also: 4 Best Ways Using SMA-200 for Trading
The uptrend started to take off in April, but the Golden Cross happened mid-May. Seeing this example, you may ask "How come the signal is too late? The EU has already rallied before the Golden Cross appeared!"
You are right in your observation, but keep in mind that this signal indicates a strong breakout, not the start of a trend. Moreover, the Golden Cross is based on a Moving Average which is a lagging indicator.
Nevertheless, the high accuracy of these signals indicates a strong bullish sentiment in the market. It is not recommended to look for sell opportunities after the appearance of a Golden Cross.
Some traders and analysts regularly check for Golden Crosses on the chart. The aim is not to trigger a buy position, but to read the market sentiment based on a technical perspective.
Death Cross
Death Cross is a signal that starts a bearish market; formed when a lower period Moving Average crosses a higher period Moving Average from above. For example, the 15-day MA crosses the 50-day MA from above, the 50-day MA cuts across the 100-day MA from the upper side, and so on.
When a Death Cross happens, the higher period Moving Average will automatically become a new resistance in the upcoming bearish market. Let's say the 5-day MA moves below the 15-day MA. The 15-day MA line will then become the new resistance when the price declines.
Compared to the Golden Cross, the Death Cross gives an arguably weaker signal. In the short term, Death Cross signals tend to be canceled out by other factors playing in the market. Moreover, Death Cross signals on bigger time frames are usually considered temporary in contrast to Golden Cross signals.
Here is the description from a EUR/USD chart on the H4 time frame. You can see several crossings between 5-day MA and 15-day MA.
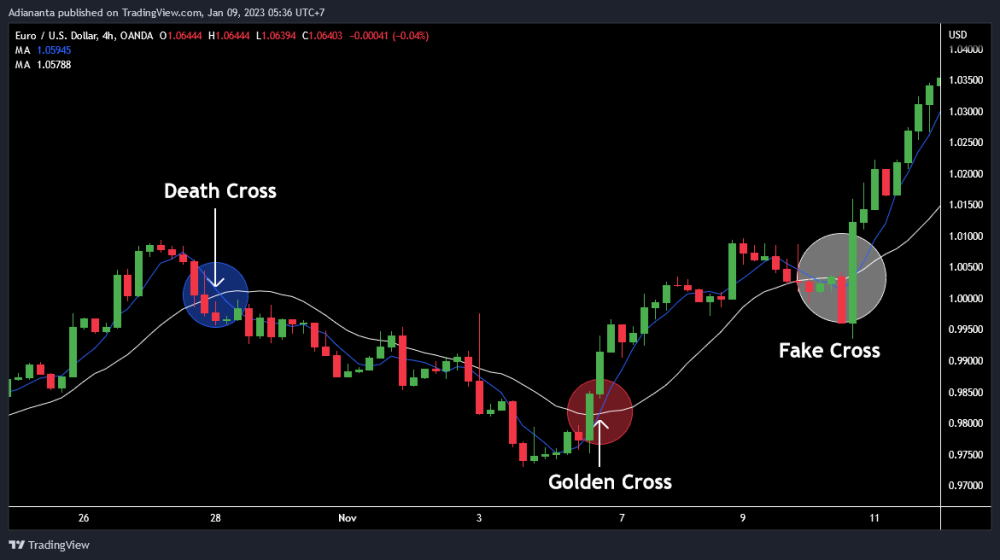
It shows that the change of direction occurs quite frequently. Between early July and mid-July, there have been six Moving Average crossings, including one fake Death Cross. There are a total of three Golden Crosses and three Death Crosses. Two out of three Golden Cross signals prove to be more reliable when compared to the Death Cross signals that only generate one good sell signal.
Note that the signal reliability on intraday time frames is low, especially if it is not accompanied by a spike in volume. It is better to complement this strategy with an Oscillator such as Stochastic, Moving Average Convergence Divergence (MACD), or Relative Strength Index (RSI) to get more accurate entry and exit points.
Trading with Golden Cross and Death Cross
Even though entry points can be identified by using MA crossing strategies from above, it's far better to use additional tools for confirmation like the RSI indicator or Heiken Ashi candle pattern.
The Combination of MA and RSI
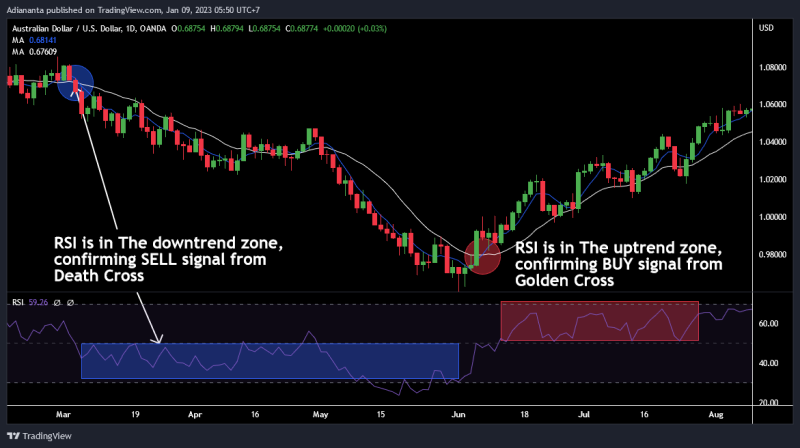
RSI (Relative Strength Index) is a technical indicator that is popularly used to detect overbought and oversold conditions. The price is considered as oversold if it is below the 30-level, while the overbought level is stated if the price is above the 70-level.
In relation to the use of the Golden Cross and Death Cross signals, the RSI indicator can be used to confirm them so that the entry point can be more accurate. An example of its application can be seen on the AUD/USD chart below:
MA and Heiken Ashi Strategy
Heiken Ashi is a type of chart that looks like a candlestick chart. However, this type of chart could give a clearer insight in describing the strength of the price trend and can filter out the noises. Its application is also much easier when compared to ordinary candlesticks. By paying attention to the length of the shadow on Heiken Ashi, you can conclude the strength of the current trend. Trend traders generally use Heiken Ashi's bearish and bullish traits to enter the market on pullbacks.
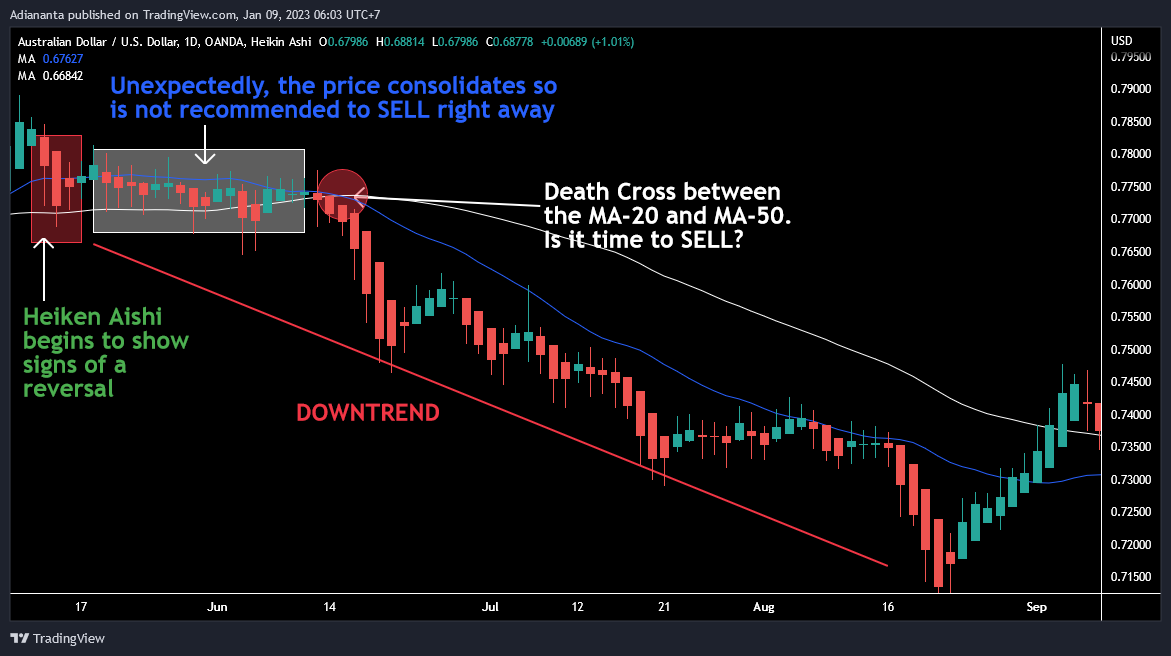
In connection with the Golden Cross and Death Cross signals, Heiken Ashi usually shows signals earlier than the MA crossings. In the example of the EUR/USD chart below, you can see that the formation of a bearish Heiken Ashi candlesticks has indicated a downtrend. Yet, the first pullback from the trend actually moves in consolidation, so it is not a good point to enter with a sell position right away. Only after the Death Cross appears then the Heiken Ashi forms a more promising downtrend signal.
MA crossing strategy has indeed become a "champion" for the majority of technical traders. The simplicity and the signals it shows are the reasons why the Moving Average indicator takes the highest place in terms of popularity among traders.
Even so, a trading strategy utilizing technical indicator crossings would be better if it was supported by other indicators or technical analysis methods. One of the most recommended strategies that don't involve any indicator is chart pattern analysis. You can learn about it further in the "Introduction to Forex Technical Analysis with Chart Patterns".