 Dedicated FREE FOREX VPS
 Free FOREX Virtual Private Server
 MT4 Demo Contest, Get $500
 Sign Up for an Account, Claim 60% Deposit Bonus
 Free MT4/MT5 VPS 2024
 Send E-mail and Get Free Merchandise
 $1K Refer a Friend Bonus for Pepperstone Pro clients
 Maximize Your Earnings with 100% Deposit bonus
 Trade to Win, $5,000 Monthly Demo Contest
 Claim 30% + 15% Deposit Bonus from LiteFinance
From identifying the trend to using it as a trend filter, there are many uses of SMA-200. How do they work and what can you do to improve your trading with the strategies?
Simple Moving Average is the most popular among other types of Moving Average. It is often used with a 200-day period adjustment. The said indicator is found on many trading charts of traders from all levels, from financial institutions to retail traders.
However, the Simple Moving Average (SMA) is rarely used as a stand-alone indicator due to its lagging nature. It is often employed in tandem with an indicator of leading nature so it can confirm SMA's signal.
Using the SMA 200 for trading can provide several advantages. Here are a few examples:
- Support and resistance levels
- Trend identification
- Filter for trade signals
- Crossover strategy with other MA line
To learn further about each advantage above, let's go to the next part.
1. SMA-200 as Support Resistance
Next up we will take a look at how SMA-200 is used as support and resistance. Traders most likely see a support resistance line that appears as a static or dynamic line.
The line that is made of the SMA-200 indicator can be used as a reference of support or resistance level, depending on the price position. Here is an example portrayed on a EUR/USD chart:
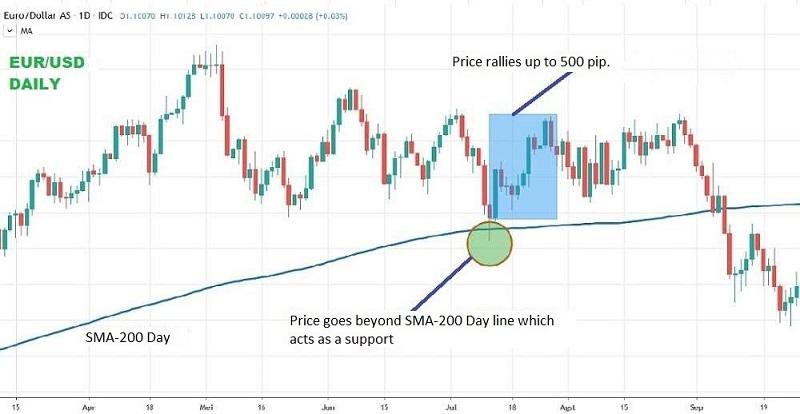
The chart above shows that market participants generally act when the price nears an SMA-200 line. When the price moves around SMA-200 support, the sellers tried to bring the price lower.
But when they fail to do so, the buyers react strongly and bring the EUR/USD to rally up to 500 pips. That strategy is often used for medium to long-term trading because SMA-200 indicator references are mostly used on the daily chart.
2. SMA-200 As A Trend Indicator
Trading along the trend is relatively effective and easy even for a newcomer. In general, traders can recognize the ongoing trend in the market by looking at the price chart with the help of the Moving Average line. SMA-200 is one of the most popular long-term indicators for such a purpose.
If the price today is below the SMA-200 line, then the market is bearish. Said situation indicates that the sellers are dominating the market.
On the contrary, if the price is above the SMA-200 line, the market is generally on the uptrend, meaning that the market is being controlled by the buyers which creates a bullish trend.
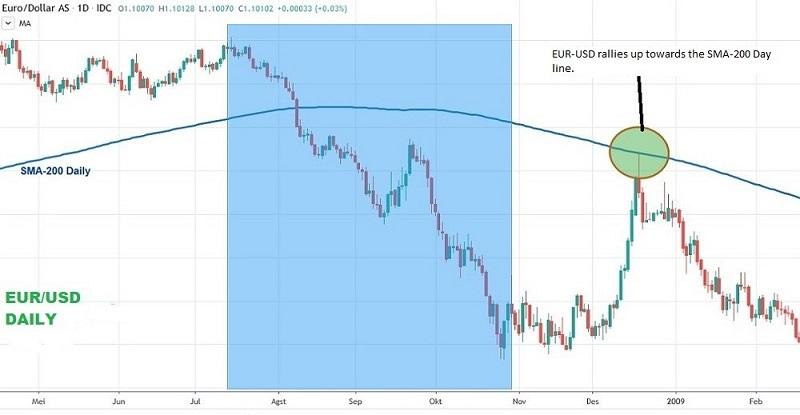
For example, during the financial crisis in 2008, EUR/USD plummeted to 3500 pips or 21.58% only in 3.5 months. After the launching of the Troubled Asset Relief Program (TARP) on October 14, 2008, followed closely by bond purchases, market sentiment toward the Euro turned positive and prompted the EUR/USD to rebound.
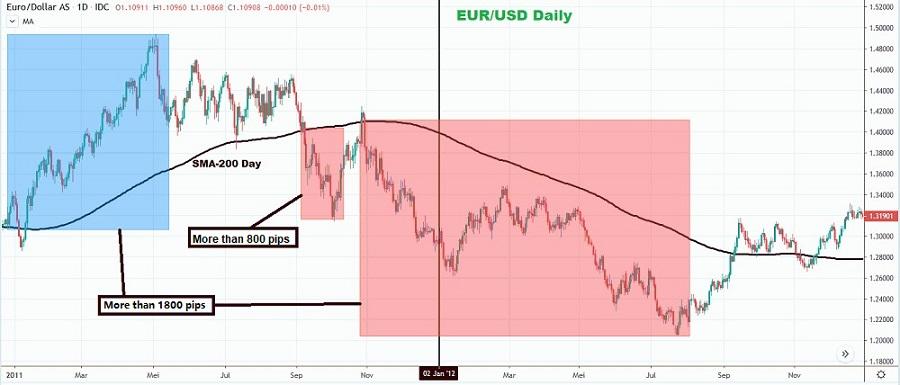
That currency pair rallied up to 2400 pips or 19.35% from its lowest price all the way to the SMA-200 line as depicted in the image below:
3. SMA-200 As A Trend Filter
SMA-200 Day is also used as a trend filter. From the previous part, traders can conclude that price movements above the SMA-200 are bullish while movements below the indicator are bearish. Then, another indicator will be used to complement this reading.
As we have explained before, the Moving Average is an indicator of lagging nature. Therefore, it needs a complementary indicator of leading nature which is often found on oscillating indicators such as RSI, Stochastic, MACD, etc.
For example, a trader employing the RSI indicator sees that the price is moving above the SMA-200 line. It is only reasonable if he makes a buy entry after the RSI rises from the oversold area (below 30).
But when the price is moving below SMA-200, he can look for sell opportunities from RSI's downward crossing across the overbought area (above 70).
That is an example of how SMA-200 Day is used as a trend filter combined with a complementary indicator. For your information, overbought and oversold signals are good indications to confirm significant price movements. Usually, they bear strong momentums that are good for big profit-taking.
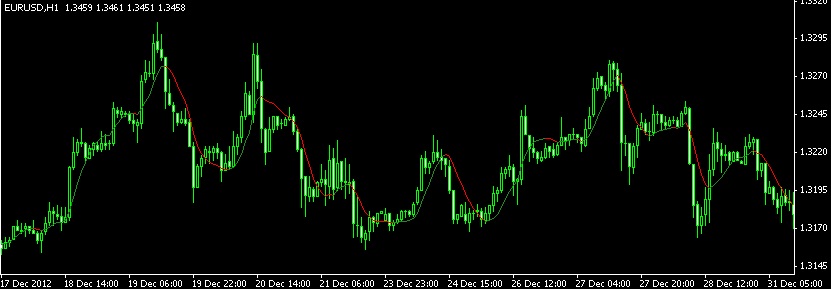
On the same EUR-USD Daily example from 2011, the crossing of the SMA-200 line happened three times on three different occasions, while in 2012, it only happened once.
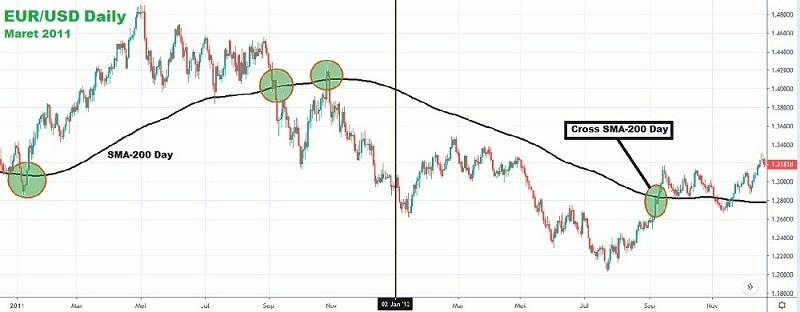
Here we can see that every crossing that occurred on the SMA-200 line always followed by steady and long-lasting price trends as well as big pip movements.
Forex trading strategy that utilizes SMA-200 Day is a relatively easy method to apply. As depicted above, the price tends to move up after it has crossed the SMA-200 line, so it is safe to say that traders may go long after the price crosses the SMA-200 line. The stop loss recommendation is around the Moving Average line.
4. Moving Average Crossover Trading Strategy: SMA-200 and SMA-100
Many traders are using the Moving Average as a reference point before deciding an open position. Aside from being used as a support resistance level, trend indicator, and trend filter, SMA-200 can also be combined with another Moving Average line. The said strategy utilizes SMA-100 whose crossovers with the SMA-200 can be taken as the trading signals.
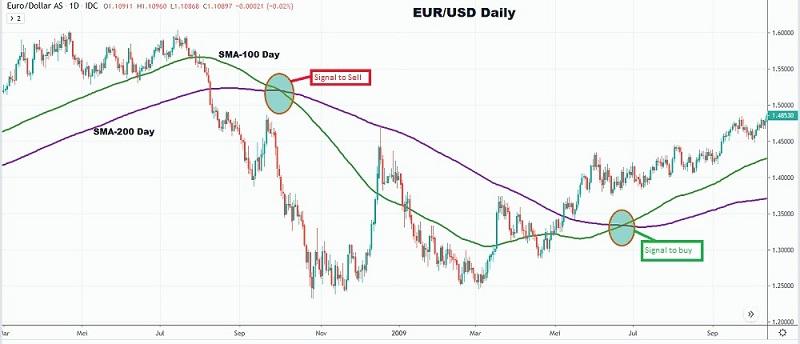
As depicted on the EUR/USD chart above, a signal to sell shows up when the SMA-100 line cuts off the SMA-200 Day downward, whereas a signal to buy appears when the SMA-100 line crosses SMA-200 Day from below.
That image gives an example of the SMA-200 line and SMA-100 in action, although the lines do not have to always be paired in that manner. Traders may also pair SMA-200 with SMA-50 or other SMA lines, or even with the Exponential Moving Average (EMA).


2 Comments
Rafael
Jan 23 2024
I'm somewhat intrigued by the concept of the 200-day Moving Average. I've come across numerous trading articles and sources advocating for the use of the 200-day Simple Moving Average (SMA) or the Moving Average Convergence Divergence (MACD) with a 200-day period.
I'm keen to understand what makes the 200-day Moving Average special. Why is it widely favored by both amateur and professional traders? Additionally, I'm curious about the distinction between the Simple Moving Average and just the general term "Moving Average." Your insights on this would be much appreciated. Thanks!
Mark
Jan 25 2024
Hey there! About the 200-day Moving Average, it is considered a long-term indicator, providing a smoothed average over a significant timeframe. This makes it particularly useful for identifying broader trends in the market. Traders often look at the crossover of the short-term moving average (e.g., 50-day) with the 200-day MA to spot potential trend changes. The 200-day MA is thought to reflect a more stable and less volatile trend compared to shorter-term moving averages.
Now, concerning the difference between Simple Moving Average (SMA) and Moving Average (MA): all SMAs are MAs, but not all MAs are SMAs. The SMA is a specific type of Moving Average. The primary distinction lies in the calculation method. The SMA computes the average of a set of prices over a specified period, giving equal weight to each data point. On the other hand, other types of moving averages, like the Exponential Moving Average (EMA), assign different weights to recent prices, making them more responsive to recent market movements.