Dedicated FREE FOREX VPS
 Free FOREX Virtual Private Server
 MT4 Demo Contest, Get $500
 Sign Up for an Account, Claim 60% Deposit Bonus
 Free MT4/MT5 VPS 2024
 Send E-mail and Get Free Merchandise
 $1K Refer a Friend Bonus for Pepperstone Pro clients
 Maximize Your Earnings with 100% Deposit bonus
 Trade to Win, $5,000 Monthly Demo Contest
 Claim 30% + 15% Deposit Bonus from LiteFinance
Pprice movements in forex trading always fluctuate in a relatively short time. Such movements enable technical indicators to read patterns from prior prices as well as predicting the next price movements.
Technical indicators are tools that traders use to analyze historical price data and make predictions about future price movements. There are hundreds of different technical indicators available, and each one has its strengths and weaknesses. Some indicators are better suited for identifying trends, while others are better at identifying overbought or oversold conditions.
So, can you use several technical indicators at once? The answer is yes, but it is important to do so carefully. Using too many indicators can make it difficult to identify clear signals and lead to overfitting, which is when an indicator becomes too closely aligned with historical price data and can no longer predict future price movements.
A good rule of thumb is to use no more than three or four technical indicators simultaneously. When choosing indicators, selecting ones that complement each other is essential. For example, you might want to combine a trend-following indicator with a momentum indicator. The trend-following indicator would help you identify the overall trend, while the momentum indicator would help you identify potential reversals.
Backtesting your trading strategy before using it in live markets is also essential. Backtesting allows you to see how your strategy would have performed in the past and can help you identify any potential problems.
Ultimately, deciding whether to use several technical indicators simultaneously is up to you. There is no right or wrong answer, and the best approach will vary depending on your trading style and preferences.
How Do Several Indicators Work?
If you are one of the big boys, you may have the power to influence the market. But as long as you are just one of the good old traders, market movement is a given, and whether you want to or not, you must follow that to profit from it.
Well, related to the way market conditions are continually changing, if you want to be successful, you may have to use several indicators or arrange a trading strategy based on the combination of several indicators to read the market more accurately.
Why several indicators?
Why don't I use one reliable indicator?
Well, as you very well know, each indicator has its weakness. Also, although each indicator usually gives a blatant signal for one kind of market condition, it may give a false signal in different market conditions. Therefore, you would do better by tailoring the indicator you use to the ongoing market condition.
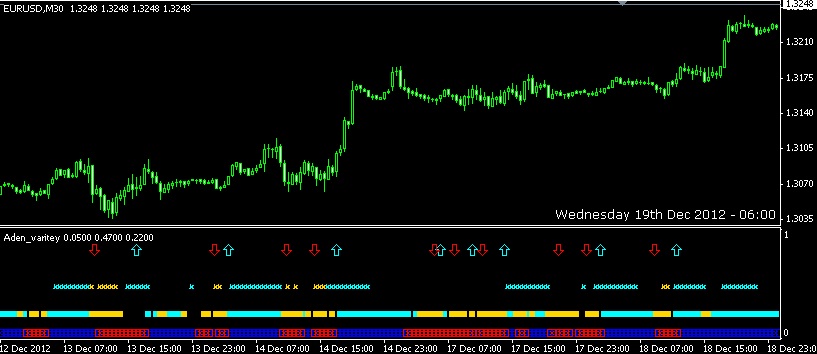
For a better understanding, I'll give you an example. When the market is sideways, I usually use a combination of SMA 200, W%R, and Parabolic SAR in a 15M timeframe. Of course, in such circumstances, I place a relatively low Take Profit (TP) level, just about 10-30 pips, according to the ongoing sideways range.
Meanwhile, if the market is trending, I usually use Fibonacci Retracement in addition to Trendline in 4H timeframe with a relatively higher Take Profit level. I generally employ Fibonacci levels as bases for TP and SL (Stop Loss) in that event.
Those indicator combinations are just examples. You may have your alchemy that works better. I want to emphasize here that you recognize the characteristics of the indicators (indicator combination) you have been using so that you will not be trapped by false signals that appear because you apply them in unsuitable market conditions.
See Also:
Conclusion
In conclusion, integrating multiple technical indicators presents a promising approach to enhancing trading strategies and decision-making in the dynamic world of financial markets. While utilizing several indicators concurrently can provide a more comprehensive view of market behavior, it is crucial to consider the strengths and weaknesses of each indicator and understand their potential interactions.
By adopting best practices and continuously refining our approach, we can unlock the power of combining technical indicators to navigate market complexities more confidently. As technology advances and market dynamics evolve, multiple indicators will play a vital role in helping traders and investors stay ahead in their pursuit of success.