 Dedicated FREE FOREX VPS
 Free FOREX Virtual Private Server
 MT4 Demo Contest, Get $500
 Sign Up for an Account, Claim 60% Deposit Bonus
 Free MT4/MT5 VPS 2024
 Send E-mail and Get Free Merchandise
 $1K Refer a Friend Bonus for Pepperstone Pro clients
 Maximize Your Earnings with 100% Deposit bonus
 Trade to Win, $5,000 Monthly Demo Contest
 Claim 30% + 15% Deposit Bonus from LiteFinance
Analyzing Fibonacci is not only about the retracement and the extension levels but also the chat patterns that can help you to identify reversals with high accuracy. Here are the 5 most well-known Fibonacci patterns to learn.
In trading, you will definitely find terms in relation to the Fibonacci sequence. It doesn't matter whether you are a beginner, advanced, retail, or corporate trader, the Fibonacci sequence will always be there as an available tool to be deployed on a chart. Over time, several Fibonacci patterns have emerged as the "magic" indicators to predict the direction of price movement.
Contents
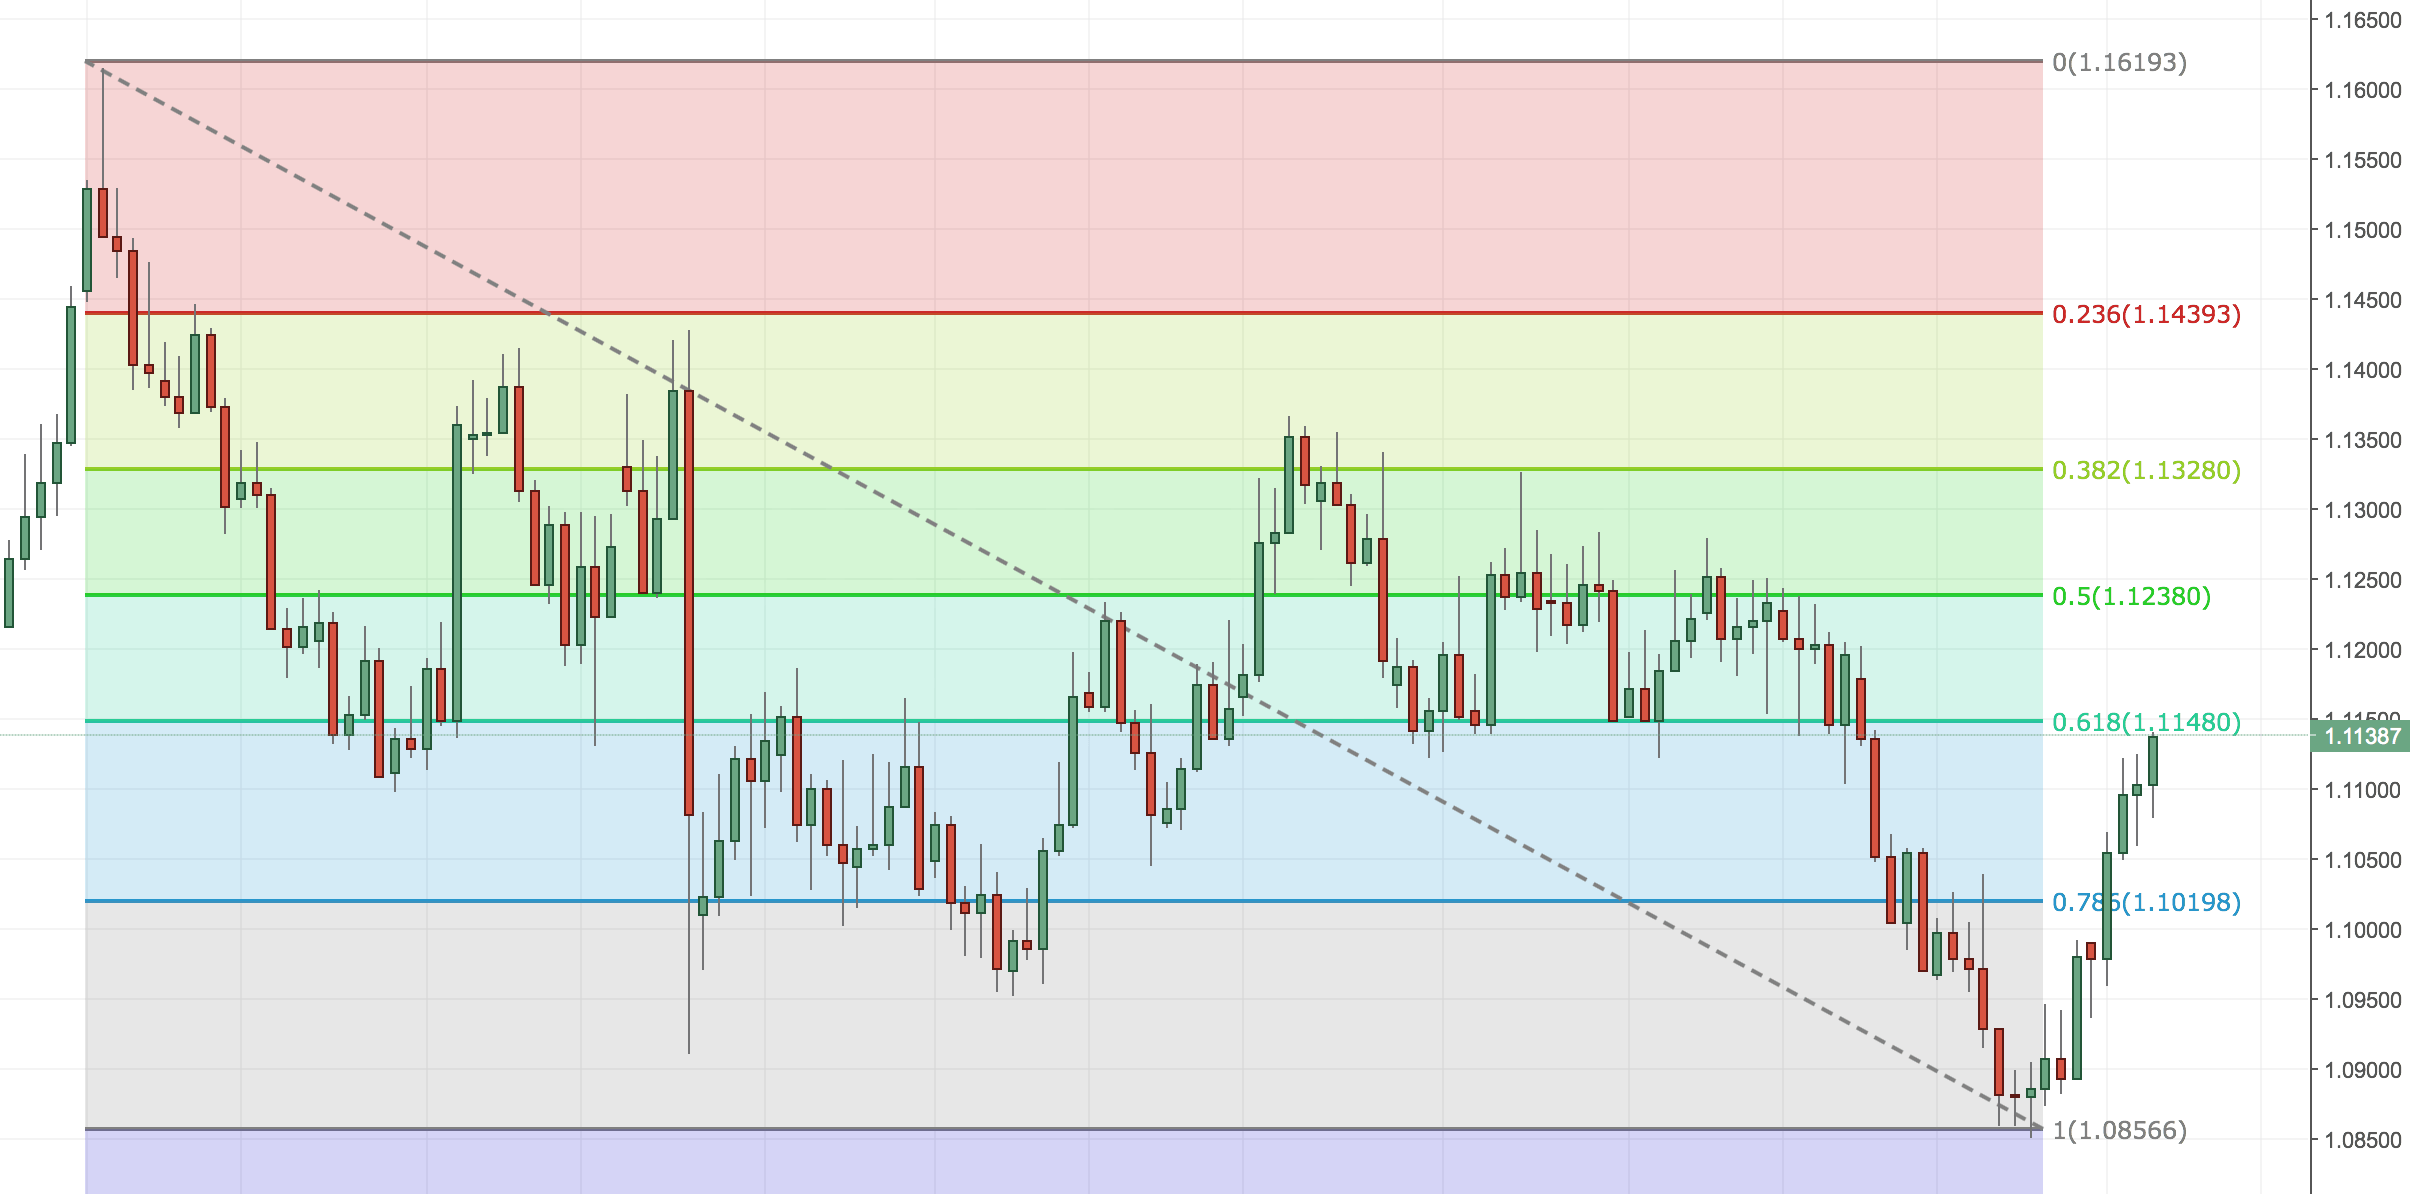
Basic Understanding of Fibonacci Retracement and Extension
Generally, traders use Fibonacci patterns to find the retracement of the current trend. Price movements in the forex market dynamically tend to "bounce" (retrace) from the Fibonacci lines, where these lines represent certain price levels that market participants always monitor before they trade.
In other words, a current trend (whether it's an uptrend or a downtrend) has some kind of "expiration" date where the price will be more likely to experience a reversal after crossing the Fibonacci line boundaries from one stage to the next.
The stages are divided into the following series of numbers:
- Retracements: 0, 0.23, 0.38, 0.5, 0.61, 0.78
- Extensions: 1.27 and 1.61
In a normal trend, the price will bounce on retracement lines. Meanwhile, if the trend is relatively strong because it is driven by certain high impact events, the price will dash through the retracement limit and is likely to experience a reversal after hitting the limit on the extension line.
See also: Calculate Fibonacci Levels Automatically
1. Practical Trading Strategy with AB = CD Fibonacci Pattern
After you understand the basics of the Fibonacci sequence, here is an example of a popular Fibonacci pattern and its application as a reversal strategy, namely the AB = CD pattern.
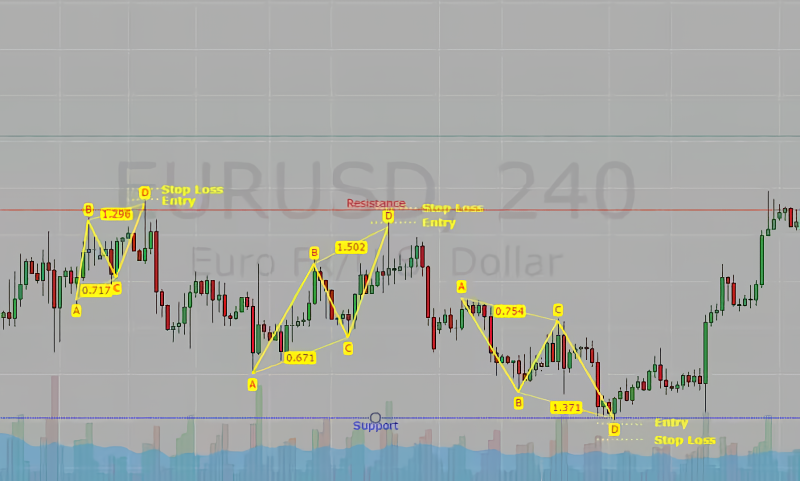
In the chart below, there are three Fibonacci patterns AB = CD in the 4-hour time frame (for intraday trading). The rightmost Fibonacci pattern has the best signal quality than the first and second patterns. Are you confused? Fret not, let's take a deeper look.
How to Draw the Lines
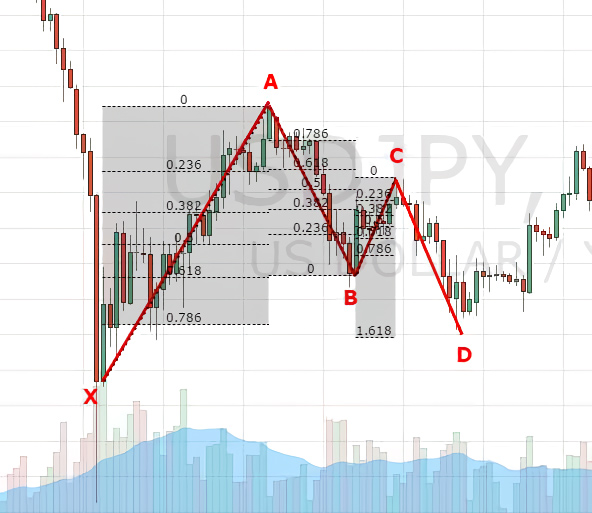
At first glance, the AB = CD pattern looks like a zigzag pattern. But keep in mind that the lines are not just drawn without certain conditions.
- The leg of the AB line is drawn from the lowest price (low) to the nearest high.
- Next, for the retracement of the AB leg, the BC line should be at the 0.38 to 0.78 retracement level (ideally at 0.68) from the AB line.
- The leg of the CD line is drawn from the low of the BC line towards the next high with a limit of 1.27 to 1.68 extension of the BC line.
This Fibonacci pattern ideally emphasizes the similarity of the leg length and period of the price movement between the AB and CD legs. However, because the forex market conditions are dynamic and always changing, the ideal reversals signal from the Fibonacci AB = CD pattern will be very difficult to find.
Therefore, the chart above shows three AB = CD patterns where the length of AB is not one hundred percent identical to CD. Even though the first and second patterns are not imperfect, the reversal can still occur due to the confluence of the last candlestick; namely bearish pin bar with the high touching the resistance line.
In terms of quality, the third AB = CD pattern signal is better than the first and second patterns because of the following criteria:
- In the third AB = CD pattern, the market is clearly in a downtrend while the first pattern happens in a sideways condition.
- The legs of AB and CD on the third Fibonacci pattern are relatively the same in terms of the length and period of the price movement.
- Its last leg (CD) is at the last candlestick where the end of the low has touched the support level.
See Also:
Looking for the Setups
If you choose the best signal from the rightmost Fibonacci pattern, you need to note that the pattern is in a bullish reversal zone (opposite of the two previous patterns). It is where the price turns bullish after the market is in a downtrend.
Place a buy limit order or a market order a few pips below the lowest price. You can install Take Profit (TP) sequentially from the Fibonacci retracement points of 0.23 to 0.78. The assumption is that you can divide the transaction sizes at these TP points to reduce the risk of a reversal before the final TP (at the very end).
From the Stop Loss (SL) side, you can place it depending on your risk management. It is recommended that SL positions have a ratio of at least 1:2 of the final TP. The bigger the ratio, the bigger the reward will be, but the greater risk for the SL to be triggered early.
2. Trading Strategy with the Gartley Pattern
Reaching hundreds of pips is no easy matter. However, with the Gartley pattern, you can try for yourself how accurate the signal of this pattern is to detect reversals. With this pattern, you can make a much bigger profit with a greater level of signal accuracy!
The Gartley pattern is popularly used as a reversal signal, not only in forex trading but also in all kinds of financial instruments. H. M. Gartley first introduced the pattern in his book "Profits In the Stock Market", from which the term "Gartley222" also becomes an alternative reference.
See also: Free Trading E-books
How Does the Pattern Look?
At first glance, the line drawing of the Gartley pattern is similar to the letter "M" (for bullish reversal) or the letter "W" (for bearish reversal). Note that the tops and bottoms of the first wings are always "sharper" (higher highs and lower lows) than the second wings.
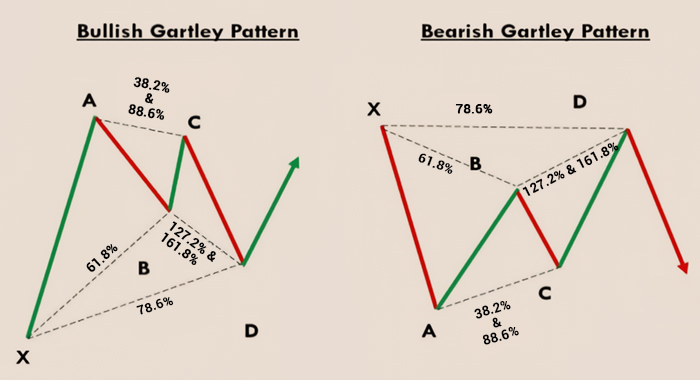
This indicates that the tug-of-war between buyers and sellers is getting weaker (converging) and is likely to lead to a reversal in which one of the parties succeeded in dominating the market. In the bullish pattern, buyers will dominate the market after being pressed by sellers, while bearish Gartley shows a reversal from the bears after being pressured by the bulls.
The Gartley pattern relies on precision in the appearance of the signal, because each leg (leg line) has its own criteria. Consequently, although basically this pattern can be used on all time frames, the Gartley pattern will be very difficult to find if there is too much noise on the market.
How to Draw the Pattern
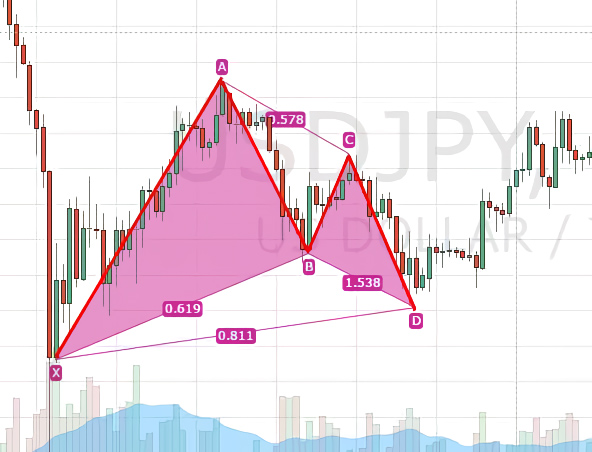
Here is an example of a bullish Gartley:
You can see that each leg (line pull) has their own criteria with general provisions in the form of a retracement of the Fibonacci line, namely:
- XA is drawn from the lowest price of a period to the nearest high. XA has always been the first and longest leg.
- AB is pulled from the high of the previous leg to the next low. AB is a retracement of (ideally) 61.8 from XA.
- BC is a retracement from 38.2 to 88.6 continuing AB. The highest point of BC (on a bullish Gartley) must not exceed the high of AB.
- The CD retrace is 78.6 from the XA. The low of the CD should not be lower than XA The accuracy of the Gartley pattern signal will be better if AB and CD meet the criteria for the Fibonacci pattern AB = CD signal.
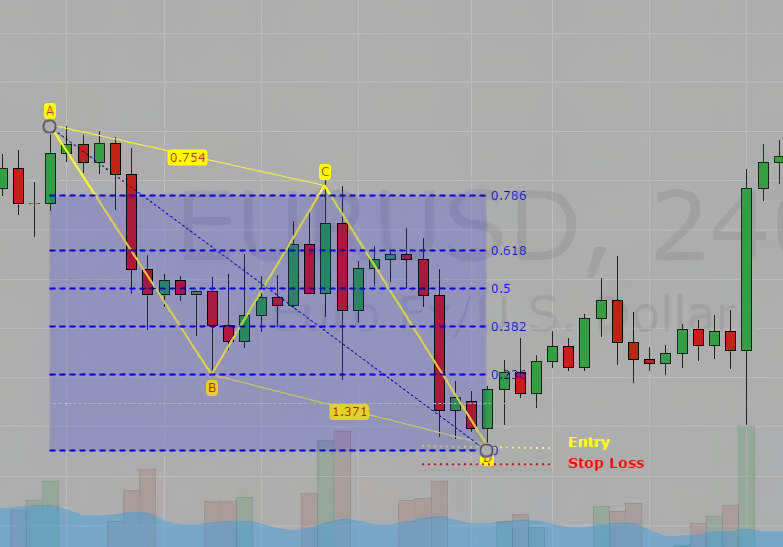
Furthermore, here are two examples of a Gartley pattern in two different time frames.
H4 chart
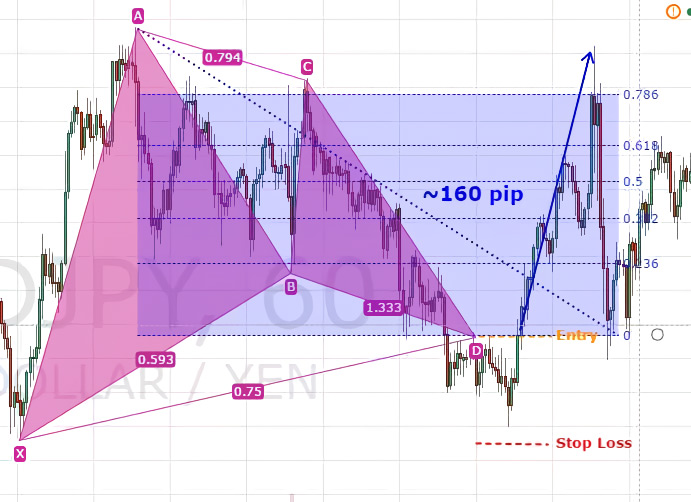
H1 chart
The signal from the first Fibonacci pattern is better than the second signal (H1) because each leg has followed the provisions above. Whereas in the second pattern, the risk of bearing a drawdown is quite high because the CD has touched the lowest price yet (since the CD was "forced" to retrace as much as 0.75 from the XA).
See Also:
Setting Up the Trade
Fibonacci patterns are quite accurate when all the legs meet the requirements. Therefore, we will use a valid Gartley pattern to set up a trade:
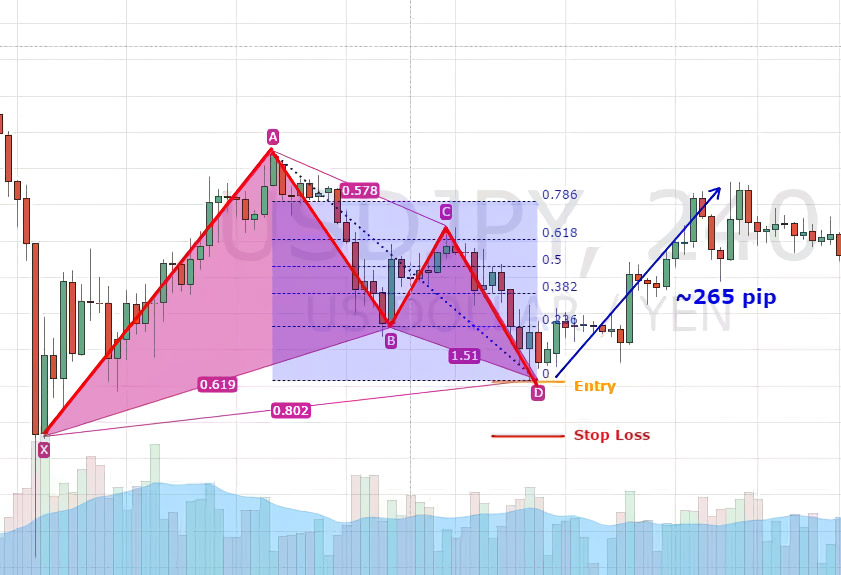
The entry position will generally be a few pips from point D as the last leg. It is recommended to use a pending order so that the order is executed only when the price movement has actually touched the intended level. If you use market orders (because you don't want to miss the moment), wait until the price moves a few pips away from point D.
The Stop Loss is placed only a few pips from the point of the initial leg X because the XA is assumed as the starting point of the highest volatility jump. In other words, if the price does move beyond point X, then you better cut your losses.
As for the Take Profit, you can draw a Fibonacci line at points A to D. Use multiple TP and distributes your transaction size wisely at the Fibonacci points of 0.38 to 0.78. If you only want one TP, then take the safest TP position between the 0.3 to 0.5 Fibonacci retracement points.
3. Trading Strategy with the Bat Pattern
At first glance, the Bat pattern looks similar to the Gartley pattern, but there are actually differences between the two. The term "Bat pattern" was popularized by technical analysts because the drag of the lines is similar to the profile of a bat. The two "wings" are almost commensurate in length due to the key principle in the 88.6% retracement of the last leg.
Like most Fibonacci patterns, the Bat pattern has both bullish and bearish versions. Here's an example:
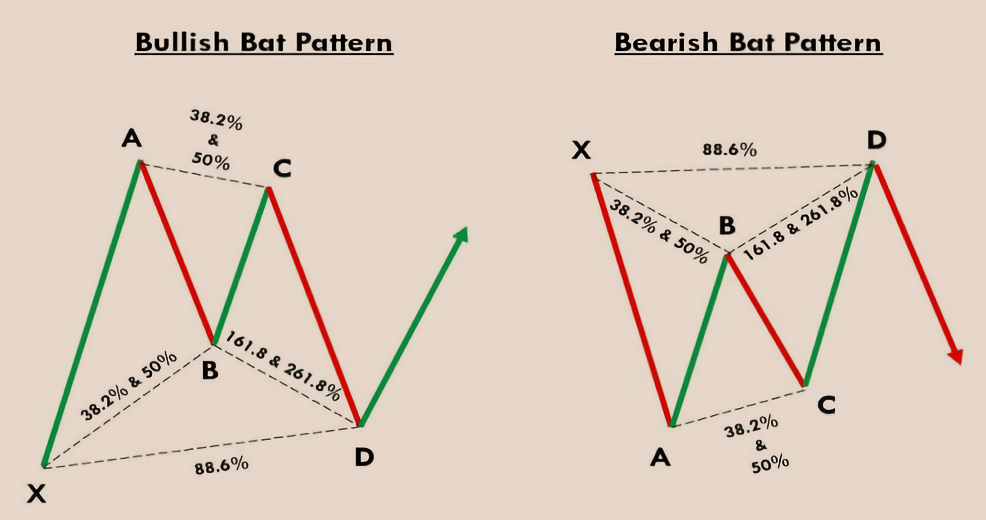
Fibonacci Bat patterns generally indicate a strong trend experiencing a retracement for a while. The last leg of the Bat pattern provides a reversal signal for traders to open positions with relatively small risks.
Drawing the Bat Pattern
Here is an example of a bullish Bat:
Each leg is drawn on certain criteria based on Fibo retracement as follows:
- XA is the first leg and the longest leg. The line is drawn from the swing low to the swing high.
- AB is a 38.2% to 50% retracement of the XA.
- BC leg is 38.2% to 88.6% retracement of the AB. The high of BC must not exceed the high of AB.
- CD is the last and most important leg of the Bat pattern. Ideally, the CD is a retracement of 88.6% from XA and an extension of 161.8% - 261.8% of BC. It is at the foot of the CD that you can open the position.
The most striking difference between the Bat and Gartley patterns is the length of the last leg compared to the initial one. In the Bat pattern, the risk of the opening is smaller than that of Gartley because of the 88.6% retracement of CD from XA. At this level, the price has most likely touched the saturation point and is ready to bounce (reversal) from its support or resistance point.
The Practical Application of Bat Patterns
The Bat pattern will give signals with good accuracy if the pattern of the legs has followed the procedure correctly. Fibonacci patterns can be used on any time frame, but to avoid false signals it is recommended to use the H4 or higher.
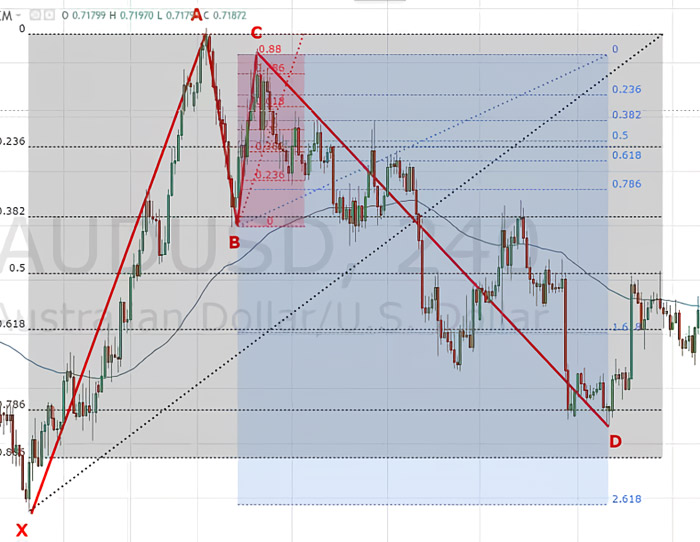
The following is an example of a trading strategy with a bullish Bat on the AUD/USD chart:

First, you can prepare to make a pending buy order (buy limit) at point D when the Bat pattern is complete (BC 88.6% of XA). After that, place a Stop Loss at point X or a few pips below it. As for TP, you can put it at the 61.8% retracement level from the swing high of A to the swing low of D. If you want to be more conservative, you can consider changing the TP position below that, or if you are an aggressive trader, raise the TP to 78.6% retracement.
It should be noted that in the example above, it takes a holding position for 11 days to reach 200 pips Take Profit. You may need to calculate additional trading fees for the swap rate (rollover interest) on the pair traded.
4. Trading Strategy with the Butterfly Pattern
The Butterfly pattern is one of the Fibonacci patterns with a basic 4-leg pattern (XABCD). What sets it apart from the previous patterns is that its longest leg is put on as the last leg. In other words, the last leg (CD) is the Fibonacci extension of the original leg.
The Butterfly pattern formation provides trading opportunities with signals at extremely high or low price levels because of its longest last leg. That way, traders can immediately open a position to anticipate a reversal once the longest leg has formed a complete Fibonacci pattern.
Here's an overview of bearish and bullish Butterfly patterns:
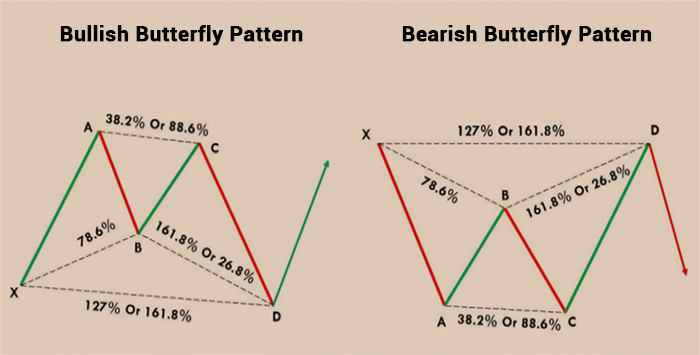
How to Draw the Butterfly Pattern
At first glance, the basic line drawing of the Butterfly pattern is similar to the wings of a butterfly silhouette. On a bearish form, the Fibonacci pattern has point A as the lowest price (lowest low) and point D as the highest price (highest high). Conversely, on the bullish from, point A serves as the highest price while point D is the lowest price.
Here is an example of a bearish Butterfly on a chart:
Those lines are drawn based on the retracement or extension of the Fibonacci lines with the following rules:
- XA is the first leg and is pulled from the highest price to the lowest price when the price is falling sharply.
- AB is a 78.6% retracement of the XA and is pulled when the price rises again.
- BC leg is pulled when the price drops again with a retracement of 38.2% to 88.6% of the AB.
- CD is the last and most important foot. It is pulled when the price goes up sharply with an extension of 127% to 161.8% of the XA. Ideally, the CD should also be the 161.8%-261.8% extension of the BC.
Traders can immediately open a position to anticipate a reversal as soon as the CD leg is extended according to the rules above. Since the last leg is the longest leg, the accuracy of the reversal is quite reliable.
How to Use Butterfly Patterns in a Trading Setup
Like the previous chart patterns, the Butterfly pattern has a high degree of accuracy when all the rules of the legs have been met. This pattern can also be used on all kinds of time frames, but it is recommended to use an H4 chart or higher, as to minimize the risk of noises and fake signals.
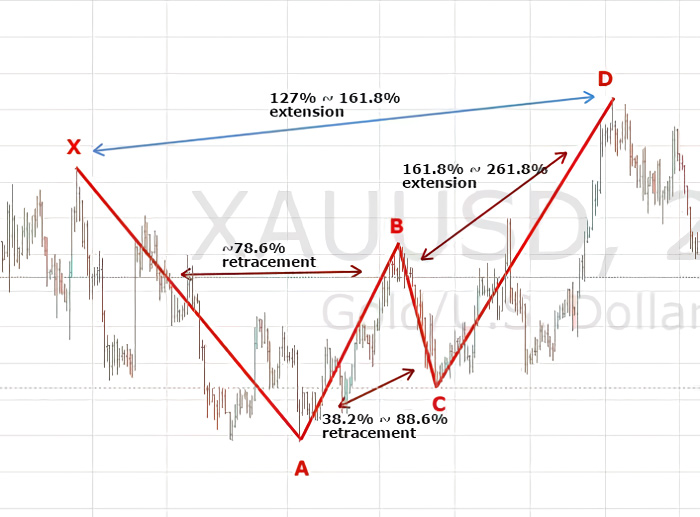
The following is an example of the application of the bearish Butterfly on an XAU/USD chart:
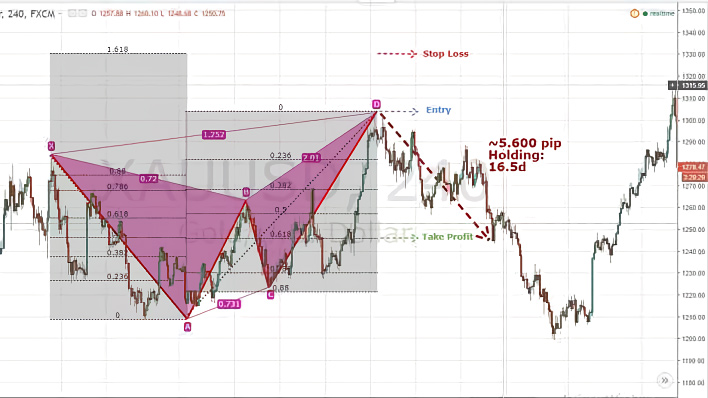
You can immediately open a short position when the CD leg is complete, forming a Butterfly pattern (CD extension 127%-161% from XA). Stop Loss (SL) is placed at the Fibonacci extension 161.8% of the XA. Meanwhile, you can target the Take Profit (TP) position according to your risk management rule. If you are a conservative type, place the TP on the 50%-61.8% retracement of the AD. On the other hand, place the TP parallel to point A if you are more on the aggressive side.
From the example above, with a holding position for 16.5 days, the total profit achieved is approximately 5,000 pips if you place the TP conservatively.
5. Trading with the Crab Pattern
The Crab pattern belongs to the Fibonacci XABCD pattern, where the basic pattern forms 4 continuous lines. Each line is drawn based on the Fibonacci retracement and extension of the previous line (except the initial leg, XA).
The Crab pattern is used as a trading signal when a trend has reached its peak and is ready to reverse. This is because the entry signal of the Fibonacci pattern will appear when the last leg (CD) extends by 161% of the initial leg length (XA).
Identifying the Crab Pattern
At first glance, the Crab pattern looks like a Butterfly pattern because the last leg is the longest leg. The difference is that the Crab pattern has the last leg with a longer extension, which is 161.8%.
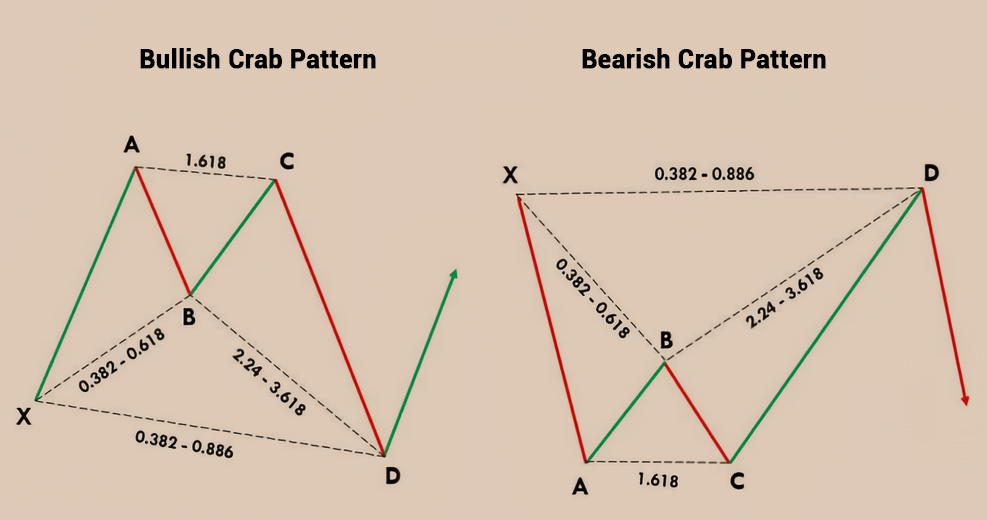
Here is an example of an identified bearish Crab on a price chart:
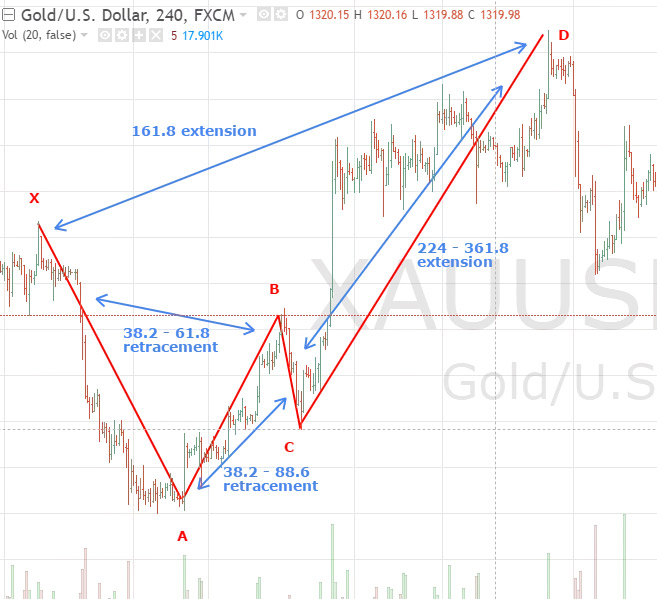
- The first leg (XA) is drawn from a sharp drop from X to A.
- The second leg (AB) is a 38.2-61.8% retracement of XA.
- The third leg (BC) is a 38.2-88.6% retracement of AB.
- The last leg (CD) was pulled from the extension of 161.8% of XA. Ideally, the CD should also extend from the 224-361.8% extension of BC.
- Traders can open short positions when the last leg of the bearish Crab reaches a 161.8% extension of the XA.
How to Trade with Crab Patterns
The Crab pattern can be used in any time frame. For beginners, it is recommended to use it on an H1 chart or higher. This limit is important to avoid the risk of fake signals due to market noises on smaller time frames.
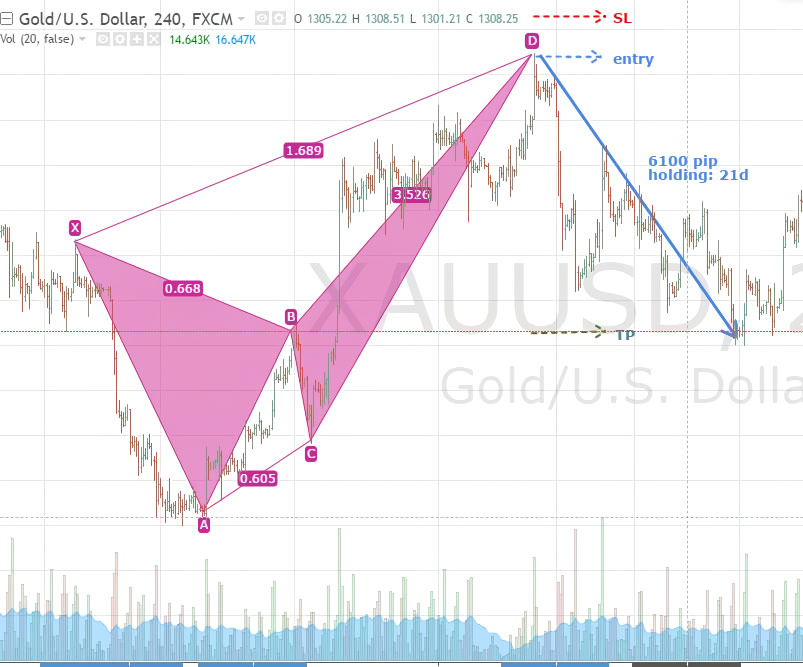
In the picture above, you can see a bearish Crab on an XAU/USD H4 chart. The first leg is drawn from the decline in price from point X to A, followed by the return of the uptrend until it reaches the saturation point of the CD leg. You can immediately open short positions when the last leg reaches a 161.8% extension of XA.
The entry position is a few pips above point D. As for TP, if you are conservative, it will generally be placed parallel to point B. But if you are a risk-taker, the TP can be lined with point A. The crab pattern provides an opportunity to trade with a small risk and high profit because the ideal risk-to-reward ratio is above 3R (reward is 3 times greater than risk). Therefore, the Stop Loss measurement should be 3 times further than the Take Profit.
So there we go! The 5 Fibonacci patterns you can recognize on your chart as a powerful analytic tool in your trading strategies. If you have any suggestions or additional information, please post them in the comments section below.
Apart from the 5 patterns above, there's also a popular Fibonacci pattern called the Shark pattern. How to identify the pattern and what sets it apart from other Fibonacci patterns? Find out more at Your Definitive Guide to Trade with Shark Patterns.


2 Comments
Lydya
Apr 21 2024
Hey, just checked out this article and got interested in the Fibonacci bat pattern they talk about. It seems like it suits my style because it indicates strong trends pausing before a possible reversal, with relatively low risk. What stands out are the specific retracement percentages they mention:
So, here's the thing: Are the Fibonacci percentages from XABCD in the bat pattern always the same? Or can we tweak them as long as the pattern resembles a bat?
Lionell
Apr 25 2024
hello too! In the Fibonacci bat pattern, there are typical percentage retracements for each leg, as mentioned in the article you read. However, trading isn't one-size-fits-all, so while those percentages are common, traders often adjust them based on their own analysis and trading strategies.
As long as the overall pattern resembles a bat and fits your trading style, you can experiment with different setups and adjustments to see what works best for you. It's all about finding what gives you the most confidence and success in the market. Hope it can answer your questions!!