 Dedicated FREE FOREX VPS
 Free FOREX Virtual Private Server
 MT4 Demo Contest, Get $500
 Sign Up for an Account, Claim 60% Deposit Bonus
 Free MT4/MT5 VPS 2024
 Send E-mail and Get Free Merchandise
 $1K Refer a Friend Bonus for Pepperstone Pro clients
 Maximize Your Earnings with 100% Deposit bonus
 Trade to Win, $5,000 Monthly Demo Contest
 Claim 30% + 15% Deposit Bonus from LiteFinance
The Heikin-Ashi candlesticks are similar yet provide more insightful signals than the traditional ones. Here are some recommended strategies to trade with the Heikin-Ashi candlesticks.
Developed by Munehisa Homma in the 1700s, The Heikin-Ashi, also spelled Heiken-Ashi, is a type of candlestick pattern that filters out market noises. The Heikin-Ashi candlesticks chart provides a better look at trend directions, making it easier for traders to read and analyze the market. In this article, we will learn a Heikin-Ashi strategy to follow the trend.
Contents
How to Calculate the Heikin-Ashi Candlesticks
Before we learn how to calculate the Heikin-Ashi candlestick, let's briefly discuss the traditional one. On traditional candlestick charts, we can see that each candlestick consists of the open and close (real body) as well as the high and low (shadows). Each of these prices reflects a value in the current period of time.
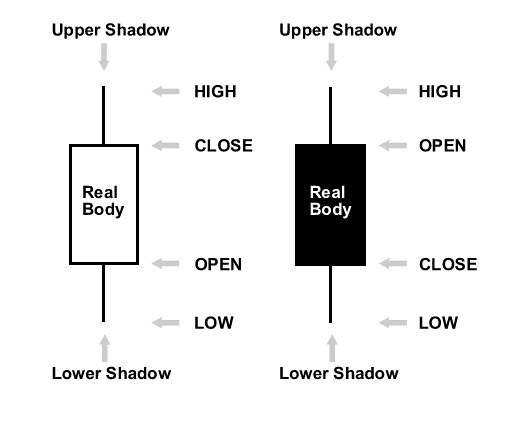
Typically, a chart uses two different colors for the candlestick to represent the direction of price movement. For instance, the candlesticks above use white and black. The white candlestick has the close price at the top and the open price at the bottom. This indicates an upward movement. On the other hand, a downward movement is indicated by the black candlestick, in which the top is the open price while the bottom the close price.
Reading charts is made easier thanks to colored candlesticks. The problem is, traditional candlestick charts are full of market noises. With the Heikin-Ashi candlesticks, however, we are able to smooth the price action since they take information from the previous period into account.
This is how the Heikin-Ashi (HA) candlesticks are calculated:
- HA Open = (Open (previous) + Close (previous)) / 2
- HA Close = (Open (current) + High (current) + Low (current) + Close (current)) / 4
- HA High = The highest between the High (current), HA Open, and HA Close
- HA Low = The lowest between the Low (current), HA Open, and HA Close
There are several things we can learn from the formula:
- The HA Open is always at the midpoint of the previous candle as it is the average value of the previous open and close.
- The HA Close is the average value of the four prices in the current period.
- It is possible for a Heikin-Ashi candlestick to not have an upper shadow if the current High is not the actual high of the current period.
- Likewise, a Heikin-Ashi candlestick may not have a lower shadow if the current Low is not the actual low of the current period.
How to Read the Heikin-Ashi Candlesticks
Now that we've learned how the Heikin-Ashi candlestick calculation works, let's further our knowledge even more. This time we'll learn how to read the Heikin-Ashi candlesticks.
First thing first, always keep in mind that the Heikin-Ashi candlesticks are adapted from the traditional candlesticks. By filtering market noises, the Heikin-Ashi candlesticks seek to improve the features that traditional candlesticks offer.
In general, the Heikin-Ashi candlesticks can be used to identify trend direction, trend strength, and trend reversal. For comparison, we will use the two charts below. The first one is a traditional candlestick chart and the second is the Heikin-Ashi candlestick chart.
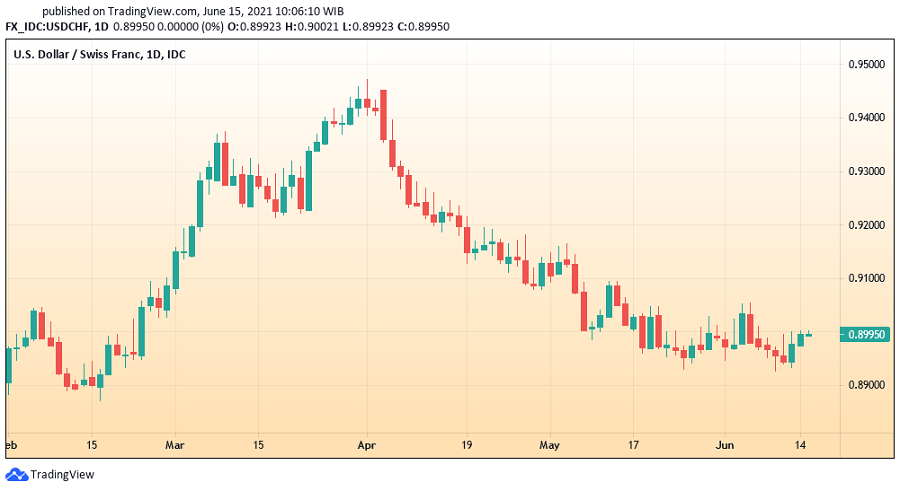
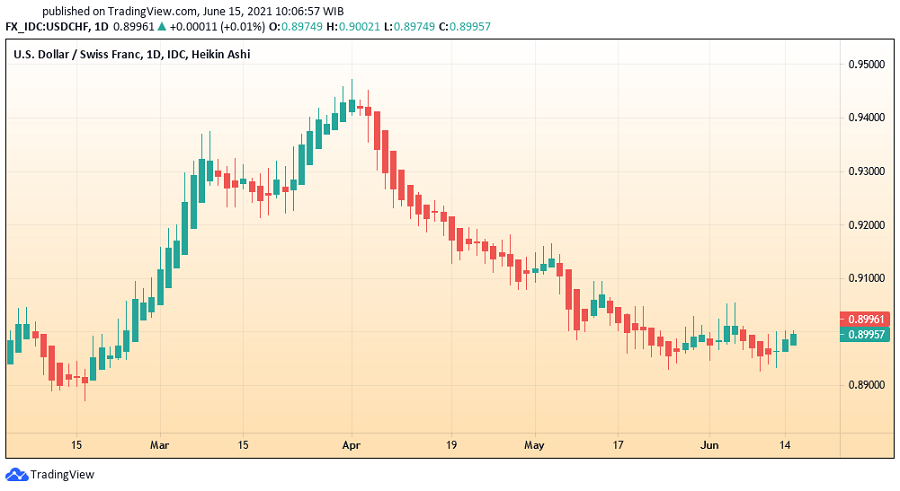
From the charts above, we can clearly see the differences between the two. The Heikin-Ashi chart appears to have no gaps because the candlesticks always start in the middle of the previous candles. Additionally, the shadows of the Heikin-Ashi candlesticks are generally tighter in range than those of the traditional ones. This is because the Heikin-Ashi candlesticks calculate the average values.
For the next part, we will delve into how to read Heikin-Ashi candlesticks for 3 different purposes.
1. To Identify Trend Directions
The green Heikin-Ashi candlesticks indicate an uptrend, and the red ones indicate a downtrend. Notice how some of the Heikin-Ashi candlesticks remain green even though the actual prices are represented by red candles. This tells us that an uptrend is still ongoing.
2. To Identify Trend Strength
As mentioned earlier, there is a possibility that the Heikin-Ashi candlesticks have no shadows. Obviously, this phenomenon also applies to the traditional chart, though it is more frequent in the Heikin-Ashi chart. So what can we infer from the shadowless Heikin-Ashi candlesticks?
The shadowless Heikin-Ashi candlesticks are an indication that a trend is going strong. Using the above chart, we can see several green Heikin-Ashi candlesticks with no lower shadows, thus indicating a strong bullish trend. On the contrary, if we spot red candlesticks with no upper shadows, we can tell that the market is undergoing a strong bearish trend.
3. To Identify Trend Reversal
The Heikin-Ashi candlesticks with small real bodies and large shadows (both upper and lower) indicate trend reversal. This signal presents an opportunity for aggressive traders who want to catch the reversals as early as possible. However, if you are a conservative trader, it's better to wait for confirmation before entering a position.
The Heikin-Ashi Trading Strategy
Heikin-Ashi candlesticks are very useful for trend trading thanks to their ability to identify trend directions, strength, and reversal. Typically, a bullish trend is indicated by green candles, and a bearish trend has red candles. That said, the color may vary depending on your platform or color preference.
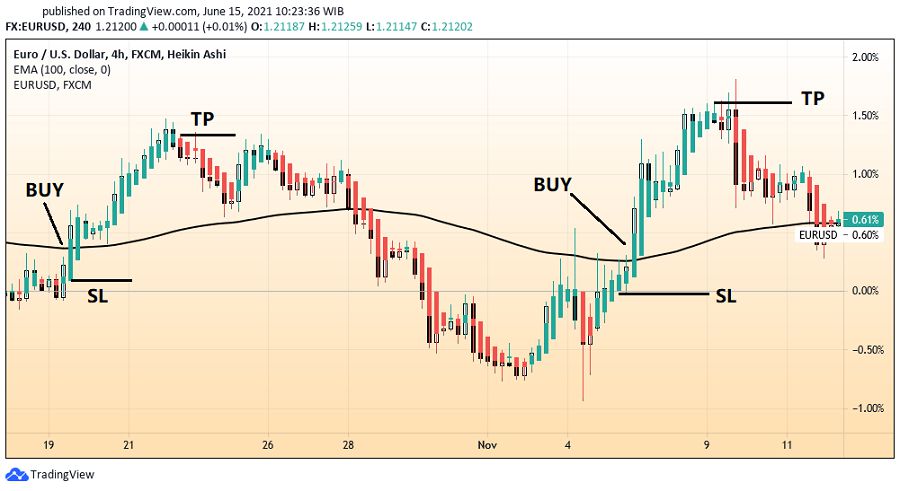
1. The Heikin-Ashi Candlesticks, Traditional Candlestick, and an EMA
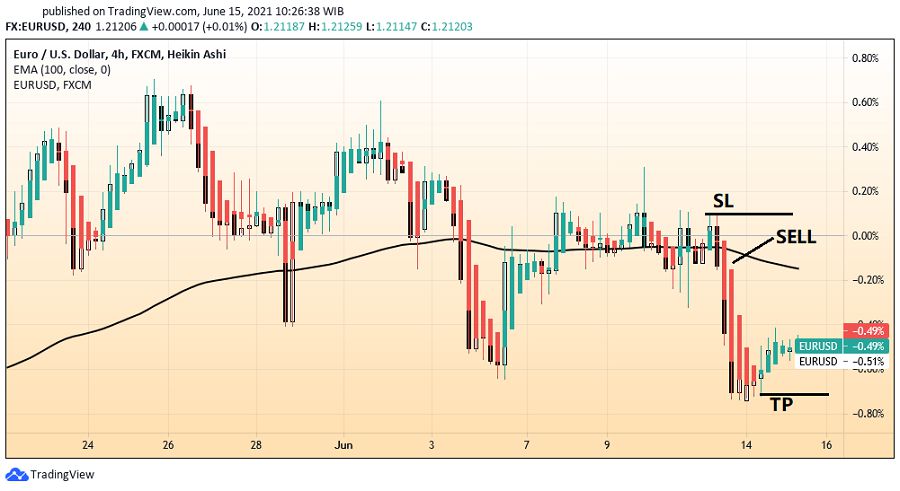
For our first strategy, we will combine the Heikin-Ashi candlesticks with a 100-day EMA. The Heikin-Ashi candlesticks are plotted on the chart along with the price action. The 100 EMA is used to identify the intraday trends. Prices closing above the 100 EMA indicate a bullish trend, while prices closing below the 100 EMA indicate a bearish trend. Any time frame is acceptable for this strategy.
For long positions, here are the rules:
- The Heikin-Ashi candlestick turns green.
- The price closes above the 100 EMA as a bullish candle.
- Enter a long position when the aforementioned two conditions are met.
- Set the stop loss a few pips below the 100 EMA.
- Exit the position whenever the Heikin-Ashi candlestick turns red.
Meanwhile, the rules for short positions are as follows:
- The Heikin-Ashi candlestick turns red, indicating a bearish trend.
- The price closes below the 100 EMA as a bearish candle.
- Enter a long position when the aforementioned two conditions are met.
- Set the stop loss a few pips above the 100 EMA.
- Exit the position whenever the Heikin-Ashi candlestick turns green.
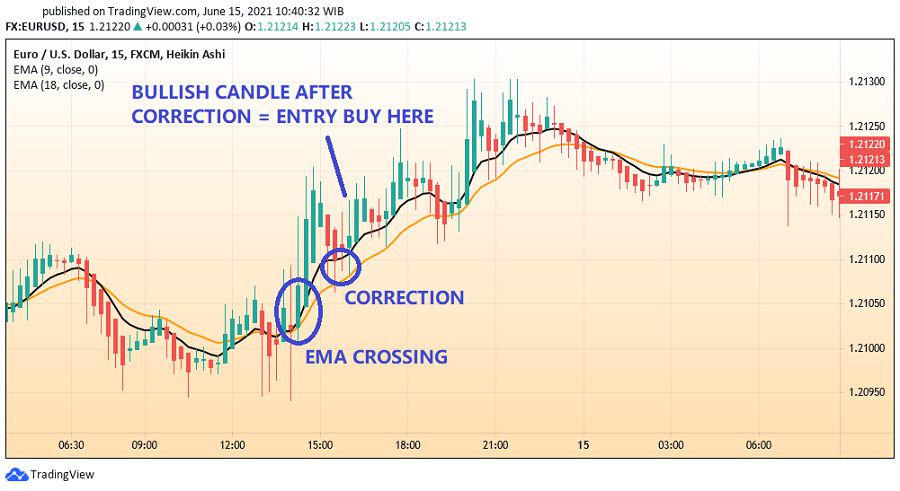
2. The Heikin-Ashi Canslesticks and 2 EMAs
For the second strategy, we will combine the Heikin-Ashi candlesticks with two EMAs. In this example, we will use the 9 and 18 EMA, although you can also use a pairing of 7 and 14 EMA, 10 and 19 EMA, or 10 and 25 EMA. This strategy works best with a 30-minute time frame.
See Also:
Below are the rules for long positions. Please note that the term "prices" here refers to the prices that the Heikin-Ashi candlesticks provide.
- After the EMA 9 crosses above the 18 EMA, wait until the prices rally above the EMA.
- The prices will then make a correction (moving to the downside) and cross below either EMA or both.
- Enter long after the price correction finishes and the Heikin-Ashi candlestick turns green.
- Set the stop loss a few pips below the low of entry candlestick.
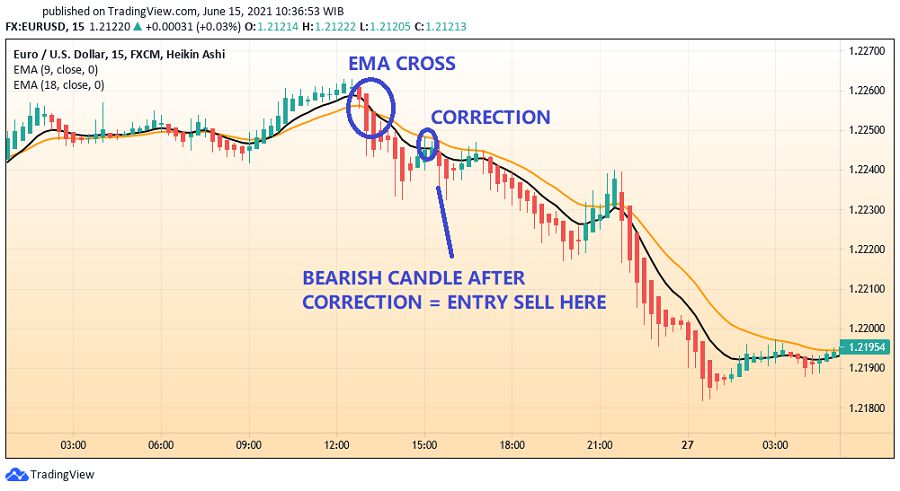
As for short positions, here are the rules:
- After the EMA 9 crosses below the 18 EMA, wait until the prices rally above the EMA.
- The prices will then make a correction (moving to the downside) and cross above either EMA or both.
- Enter short after the price correction finishes and the Heikin-Ashi candlestick turns red.
- Set the stop loss a few pips above the high of entry candlestick.
Watch for These Drawbacks
The Heikin-Ashi candlesticks are lagging, meaning that a trend is already ongoing when the indicator gives a signal. Short-term trading strategies are particularly susceptible to late entries or exits as a consequence of the in the signal. Therefore, the Heikin-Ashi candlesticks work best for long-term traders. In addition, the Heikin-Ashi candlesticks are meant to identify trends, thus they are pretty much useless in ranging markets.
Another weakness is related to the characteristic of the Heikin-Ashi. As we've already learned, the Heikin-Ashi candlesticks are a calculation. They do not represent the actual prices of the market and we should not treat them as such. We often spot a green Heikin-Ashi candlestick while the traditional candlestick already turns red. This occurrence may not be an issue in a strong and healthy trend, but what if the trend is about to change? Traders who exclusively rely on the information from the Heikin-Ashi candlesticks may be late in identifying trend reversal. Thus, it is recommended that you always keep track of the traditional candlesticks as well as a reference to the true prices.
All in all, the Heikin-Ashi is a simple indicator that can be used by beginners and experienced traders alike. This indicator is particularly useful for trend trading and long-term strategies, but not for sideway markets and short-term strategies. To get the most out of the Heikin-Ashi candlesticks, we can combine them with other indicators such as the Exponential Moving Average (EMA). Lastly, always check on the actual prices in order to minimize the risk.


8 Comments
Jouma
Jul 13 2023
Imagine you're a beginner trader like me, excited to explore different trading strategies and learn more about candlestick patterns. That's when you stumble upon something called Heikin-Ashi, developed by the legendary Munehisa Homma way back in the 1700s. It's said to be a game-changer, filtering out all that market noise and giving you a clearer picture of trend directions. Sounds pretty awesome, right?
I can't help but wonder, as a beginner, how can I actually benefit from using Heikin-Ashi? I'm itching to hear from experienced traders who have already incorporated Heikin-Ashi into their trading arsenal. How has it transformed your understanding of market trends? Have you found it to be a reliable tool for making better trading decisions?
Phil
Jul 16 2023
@Jouma: It's great that you want to hear from experienced traders who have incorporated this tool into their strategies. They can provide valuable insights into its effectiveness and impact on market trend analysis.
Experienced traders who have embraced Heikin-Ashi often praise its ability to smooth out price fluctuations and provide a clearer view of market trends. By using Heikin-Ashi charts, they may have found it easier to identify trends, spot reversals, and gauge market sentiment.
While individual experiences may vary, many traders consider Heikin-Ashi to be a reliable tool for making better trading decisions. Its unique candlestick representation and calculation methodology can help filter out noise and provide a more accurate picture of price action.
By incorporating Heikin-Ashi into their arsenal, traders have gained a deeper understanding of market trends, improved their timing for entries and exits, and enhanced their overall trading strategies.
Frederick
Nov 24 2023
To be frank, grasping the Heikin-Ashi strategy appears quite challenging for me. Even after reading multiple articles, including the one in question, I still haven't fully comprehended Heikin-Ashi, especially its calculations and the differences it presents compared to regular candlesticks. As a beginner, I find comfort in using traditional candlesticks since they are more widely discussed in various articles and books about trading. However, I do have a question about Heikin-Ashi. The article mentions that Heikin-Ashi candlesticks are lagging, indicating that a trend is already in progress by the time the indicator signals. What does the term "lagging" mean in this context?
Joshua
Nov 27 2023
In the context of Heikin-Ashi candlesticks being described as "lagging," it means that the signals or indications provided by Heikin-Ashi are delayed compared to the actual occurrence of a trend in the market. In other words, by the time Heikin-Ashi generates a signal, suggesting a change in trend direction, the market has often already started moving in that direction.
This lagging nature is a characteristic of many trend-following indicators, including Heikin-Ashi. Traders should be aware that relying on lagging indicators might result in entering or exiting a trade after a significant portion of the trend has already unfolded. It emphasizes the importance of using lagging indicators in conjunction with other tools and analysis to make informed trading decisions.
Ella
Jan 18 2024
Hello there! I have gained some understanding of the Heikin-Ashi strategy through this article. It appears to be a challenging yet highly technical approach, mainly due to the differences in its use of candlesticks compared to traditional charts. The images above the article highlight these distinctions.
My confusion arises from the apparent differences in candlestick calculation between Heikin-Ashi and traditional methods. Could you clarify the specific variations in the calculation process? The article mentions a weakness related to the characteristics of Heikin-Ashi, emphasizing that its candlesticks are a result of calculation and do not accurately represent market prices. Given this, why do we still consider the traditional chart as our primary reference?
Inno
Jan 21 2024
Hey there, despite the distinctive features of the Heikin-Ashi strategy, the traditional chart continues to be the primary reference for several reasons. The familiarity that traders and investors have with traditional charts plays a pivotal role. Over time, these charts have become ingrained in market analysis, and many individuals are accustomed to interpreting and making decisions based on the patterns and signals they offer.
Reliability is another crucial factor. Traditional charts have stood the test of time and have been extensively used for technical analysis. Traders often find comfort in relying on tools and methods with a proven track record, and traditional charts have consistently provided valuable insights into market trends and potential price movements.
Additionally, the established nature of traditional charts contributes to their widespread acceptance and usage. They serve as a common language among traders, analysts, and investors, facilitating communication and understanding in the financial community. For example, you can easily understand the traditional chart with simply know the pattern (read : Reading the Market with Simple Candlestick Patterns )
Phil
Apr 24 2024
As a newbie in the trading world, I'm curious about the concept of a sideways market mentioned in this article. It mentions that Heikin Ashi, an indicator popular for trend trading and long-term strategies, isn't as effective in sideways markets.
Does this mean Heikin Ashi isn't suitable for short-term strategies either? I'm wondering, what exactly is a sideways market? And if Heikin Ashi isn't ideal for short-term strategies, what kind of trading method is typically used with it for long-term trades? Thanks!
Terry
Apr 26 2024
In trading, a sideways market refers to a period when prices are moving within a narrow range, lacking a clear trend in either direction. During such times, price movements may fluctuate horizontally rather than trending upwards or downwards. (read : How To Trade In Sideway Market)
As for Heikin Ashi, it's indeed less effective in sideways markets because it relies on identifying trends and momentum, which are often lacking in sideways conditions. However, it doesn't necessarily mean it can't be used for short-term strategies. Instead, traders might prefer other indicators or methods better suited to identify range-bound conditions and capitalize on shorter-term price movements.
For long-term strategies, Heikin Ashi can still be valuable, especially when combined with other tools or indicators that help identify trends over extended periods. Traders may use it to capture the overall direction of the market and make informed decisions based on long-term price movements.