Dedicated FREE FOREX VPS
 Free FOREX Virtual Private Server
 MT4 Demo Contest, Get $500
 Sign Up for an Account, Claim 60% Deposit Bonus
 Free MT4/MT5 VPS 2024
 Send E-mail and Get Free Merchandise
 $1K Refer a Friend Bonus for Pepperstone Pro clients
 Maximize Your Earnings with 100% Deposit bonus
 Trade to Win, $5,000 Monthly Demo Contest
 Claim 30% + 15% Deposit Bonus from LiteFinance
EMA and SMA have been long known as the most popular Moving Average indicators. What about the Triangular Moving Average (TMA)? How does it compare to EMA and SMA?

Moving Average is probably the most used indicator among traders from all around the globe. It is not surprising considering its simple yet effective nature to provide crucial information regarding price movements. Moving Average aims to smooth out prices by eliminating the impact of random, short-term fluctuations. As a lagging indicator, it's calculated based on past prices so keep in mind that it might not always show accurate predictions of future price movements.
There are various types of Moving Averages, but two of the most popular ones are Simple Moving Average (SMA) and Exponential Moving Average (EMA). Determining which is the best actually depends on how you manage your strategy. For example, day traders tend to prefer EMA as it's more responsive to price movements, but other types of traders can just make use of a slow SMA as a dynamic support resistance.
Another type of Moving Average that every trader should know is the Triangular Moving Average (TMA). Although TMA is not as mainstream as SMA and EMA, this indicator can add significant value to your analysis.
Understanding Triangular Moving Average
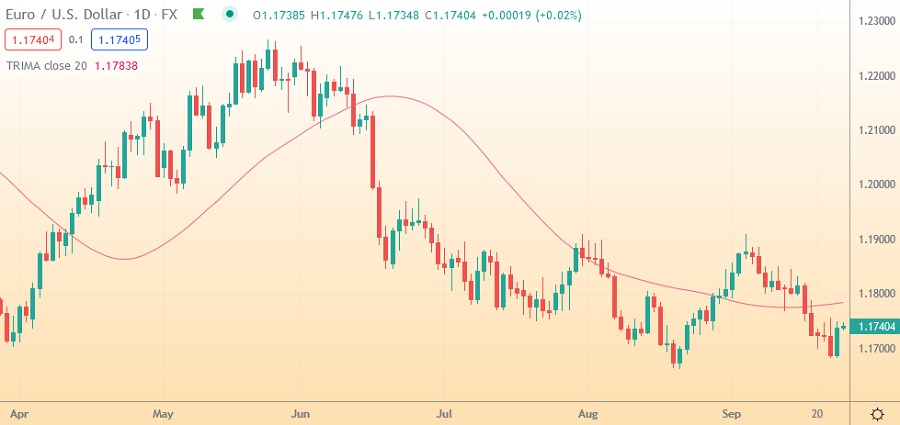
At first glance, Triangular Moving Average (TMA) may seem similar to SMA as both tools show the average price of an asset or currency pair over a specified number of data points (usually a number of price bars). However, as TMA is averaged twice, it is basically an SMA that has been averaged again. This creates an extra smooth and steady average line.
Generally, SMAs are able to provide smooth lines, but the re-averaging makes the TMA line even smoother and more wavelike. The calculated result of a TMA is not as reactive as SMA, but it can provide excellent insight to help you stay in the trend longer.
To calculate a TMA, you can use the following formula:
TMA = (SMA1 + SMA2 + SMA3 + SMA4 + … SMAx)
TMA = SUM (SMA Values) / N
Luckily, there's only a tiny chance that you're required to calculate this manually because your trading platform will handle all the work. However, you must note that not all platforms have a TMA indicator. To see if your platform does provide the indicator, you should just open a chart, then go to the indicator section. Search for "Triangular Moving Average". If it isn't there, you can try applying a standard Moving Average then go into the setting of the indicator and see whether you can change the calculation to triangular. Some platforms label the TMA as "Moving Average Triangular" or "MovAvgTriangular", so make sure to search thoroughly.
If it turns out that your platform doesn't have TMA, you can add a custom-calculated Moving Average and insert the TMA formula. Alternatively, you can also apply an SMA to your chart and then apply another SMA which uses the first SMA as its input.
See Also:
How to Trade with Triangular Moving Average
The sole purpose of TMA is to double-average the price data so that it will produce an extra smooth line that doesn't react to price changes as quickly as an SMA would. This condition can be both beneficial and disastrous, depending on what you're using the indicator for. Here are some tips to begin trading with TMA:
1. Use TMA in Trending Markets
The forex market can move in many ways; sometimes the trend is really strong (trending market), but other times it can also move sideways (ranging market). Such dynamics can happen due to many reasons such as impactful news releases and changes in market sentiment due to various causes. Each condition typically requires specific tools and strategies to overcome.
When it comes to the TMA indicator, it's highly recommended to use it in trending markets. As we have mentioned before, TMA responds rather slowly to the market changes and price movements. Because of this strong lagging nature, TMA can provide big insights to your analysis, including how far the price has gone, how long the period has taken, and what levels have been reached. Traders, particularly those who use the trend-following strategy, can prepare their trading plans more carefully and precisely using TMA.
On the other hand, TMA is not quite suitable for ranging markets. When the price is moving back and forth in a limited price range, you can easily miss the entry momentum when the price touches critical levels like support and resistance.
This can also happen in highly volatile markets. The TMA's inability to respond quickly to price movements can make you late to the game and miss many trading opportunities. However, it's worth noting that at some point TMA can save traders from fake entry signals in ranging markets. As the TMA won't react much to small price movements, it will eliminate noises and give a clearer picture of the market. It can also let you know that the trend hasn't massively shifted.
See Also:
2. Use TMA to Confirm Reversal Signals
TMA can also be used to confirm reversals but with certain conditions. Firstly, you must know that TMA is not capable of identifying overbought and oversold conditions. Also, when the TMA shows a reversal sign, the actual price usually has already shifted further and the price chart would indicate that the momentum is weakening. As TMA lags a lot, it can cause you to miss an entry opportunity.
Here's an easy example:
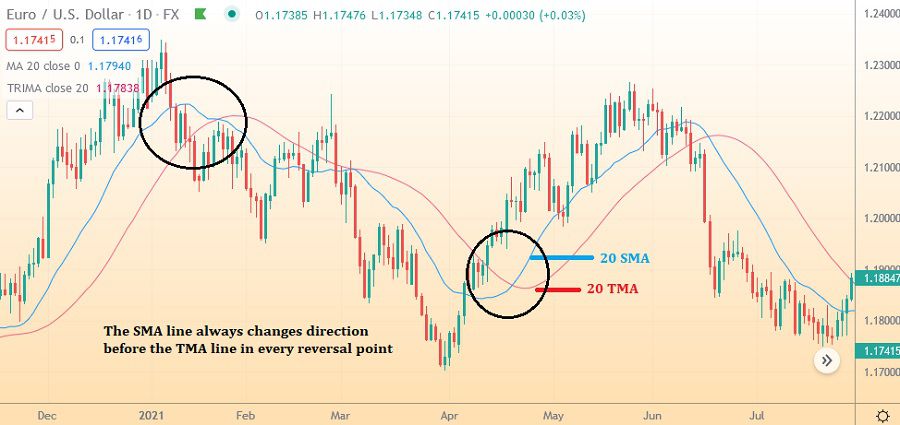
Based on the chart above, we can see that the TMA took longer to signal a reversal compared to the SMA. Therefore, if you decide to make an entry based on that signal only, you will certainly "miss the train" and end up entering the market too late. Using TMA alone is not enough to confirm a reversal. Alternatively, you can use additional tools to detect a reversal with TMA as the confirmator.
See Also:
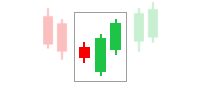
Other than that, you can also use Price Action. It often comes in the form of candlestick patterns and is most commonly used in technical trading. The most straightforward reversal pattern to spot is perhaps the Pin Bar pattern around the key support or resistance levels.
Conclusion
Triangular Moving Average (TMA) is the type of moving average that uses the average of the average. Thus, it can provide a much smoother and steadier line compared to an SMA. By using the TMA indicator, you can read the market's trend more clearly. The risk of getting trapped in false trading signals and noises in a sideway market is also very minimal.
However, remember that the TMA reacts more slowly to price movements than other Moving Averages, so it can potentially cause you to miss trading opportunities especially during high volatility. This is the downside of the TMA that you must acknowledge. If you're searching for a Moving Average that is more sensitive to market changes, then a front-weighted Moving Average like EMA is perhaps more suitable.
Nevertheless, there is no perfect indicator or Moving Average. It all depends on how you use it. Combine it with other tools to get stronger confirmations. It's always a great idea to try the TMA in a demo account before utilizing it with real capital. With the right use and practice, you'll be able to tell whether the tool matches your trading style and can help you achieve your goals.