Dedicated FREE FOREX VPS
 Free FOREX Virtual Private Server
 MT4 Demo Contest, Get $500
 Sign Up for an Account, Claim 60% Deposit Bonus
 Free MT4/MT5 VPS 2024
 Send E-mail and Get Free Merchandise
 $1K Refer a Friend Bonus for Pepperstone Pro clients
 Maximize Your Earnings with 100% Deposit bonus
 Trade to Win, $5,000 Monthly Demo Contest
 Claim 30% + 15% Deposit Bonus from LiteFinance
Smoothed Moving Average is quite similar to the Simple Moving Average, but there are certain qualities that make it distinguished. Find out how to trade with the indicator here.
The Smoothed Moving Average (SMMA) refers to a moving average that involves the use of a longer period. It provides recent prices with an equal significance to the historic ones. The calculation does not simply refer to a fixed period but instead considers all available data. The period in this case refers to the number of bars in a chart. If the chart shows the daily data, then the period represents days; if the charts display weekly data, the period will represent weeks, and so on.
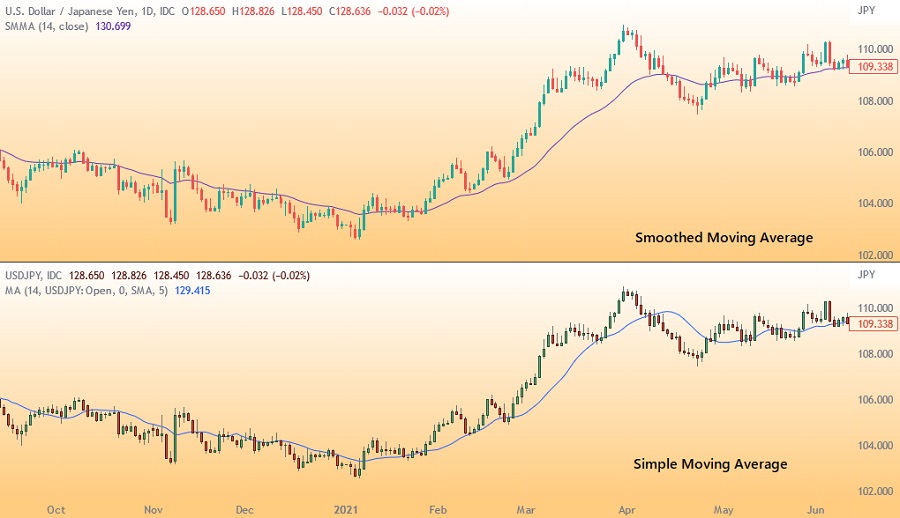
The Smoothed Moving Average (SMMA) is a trading tool that traders will likely come across in their trading journey. It is an excellent indicator tool due to its ability to confirm prevailing market trends that help to generate buy/sell signals. It is quite similar to a Simple Moving Average (SMA) because it focuses on reducing noise instead of reducing lag. This ensures that fluctuations are eliminated thus making it easier to plot the prevailing trend.
When using the simple moving average, the price data holds an equal weight in the calculation of the average. Therefore, the oldest price data tends to be removed from the moving average before a new price is added to the calculation. However, the case is different with the Smoothed Moving Average because it adopts a longer period to determine the average and this is done by assigning a weight to the price data during the computation. This ensures that the oldest price data in the Smoothed Moving Average are never removed but only have a negligible impact on the Moving Average.
Utilizing Smoothed Moving Average in Analysis
The major use of the Smoothed Moving Average is its smoothing-out function which allows the moving average to eliminate short-term fluctuations so that the trader can clearly see the prevailing trend. It is well known that moving averages generally perform best in trending markets.
A buy signal is issued when the short and intermediate-term averages move from below to above the longer-term average. In contrast, a sell signal occurs when the short and intermediate-term averages move from above to below the longer-term average.
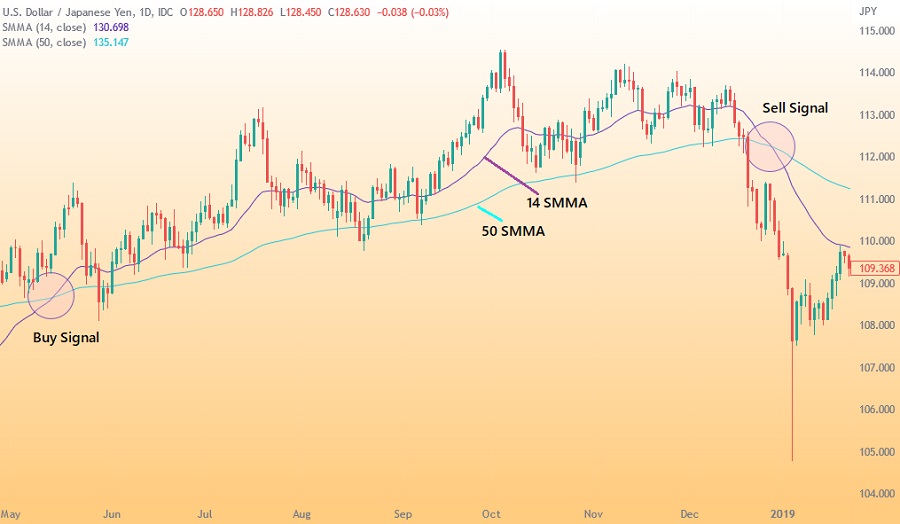
While it is possible to use similar signals with two moving averages, it is suggested by most professionals to utilize longer-term averages when trading in a crossover strategy with only two Smoothed Moving Averages.
Another trading approach to using the Smoothed Moving Average is to adopt the current price concept. If the current price climbs above the Smoothed Moving Averages, it is an indication to buy. Therefore, your trading position should be liquidated once the current price crosses below any of the two moving averages. Conversely, once the current price drops below the Smoothed Moving Averages, it is an indication to sell. Once the current price rises above the Smoothed Moving Averages, then that trading position should be liquidated.
The Smoothed Moving Average is not just limited to helping to confirm trends but also to define areas of support and resistance. It tends to be used in conjunction with other tools for signals and analysis.
How to Set Up SMMA
Even though the formula for calculating the Smoothed Moving Average is slightly complicated, traders do not have to worry about that as most trading platforms tend to have it available automatically. To set up the Smoothed Moving Average (SMMA) on your trading chart, locate the SMMA indicator from the list of in-built indicators and strategies on your trading platform. Click on it and the moving average line will be displayed on the chart. You can then adjust the parameters to suit your analytical preferences.
Like all types of moving averages, you can decide the period to be analyzed on your own as there is no standard recommended period. This is where your knowledge, instinct, and experience as a trader will come into play so that this tool can be maximized for profit.
However, despite the lack of a standard recommended period, many short-term traders tend to calculate averages over periods of 14 to 28 days while long-term traders prefer to use the 50, 100, and 200-day periods.
Among many types of Moving Averages that currently exist, EMA and SMA remain the most popular ones as shown in various strategies that we can find online. But do you have any idea of the essential facts behind such popular Moving Averages?