Dedicated FREE FOREX VPS
 Free FOREX Virtual Private Server
 MT4 Demo Contest, Get $500
 Sign Up for an Account, Claim 60% Deposit Bonus
 Free MT4/MT5 VPS 2024
 Send E-mail and Get Free Merchandise
 $1K Refer a Friend Bonus for Pepperstone Pro clients
 Maximize Your Earnings with 100% Deposit bonus
 Trade to Win, $5,000 Monthly Demo Contest
 Claim 30% + 15% Deposit Bonus from LiteFinance
Moving Average is a mainstream trend indicator, but these two indicators are actually just as effective. If you'd like to try, here is the simple guide.

Many beginners or professional traders use Moving Averages as indicators to define trading areas, identify trends, and analyze the market. It can be said that Moving Average is the "first love" for beginners, so impressive and hard to forget. Its simplicity and convenience are the main reasons why the Moving Average indicator is a favorite.
Moving Average is also very helpful for traders in conducting price analysis, determining resistance and support levels, and then helping them to determine the next step according to price movements.
There are two popular types of Moving Averages that you can use. The first is the Simple Moving Average (SMA) and the second is the Exponential Moving Average (EMA). If the Simple Moving Average shows a smoother graph, the EMA is more focused on the movement of daily fluctuations.
In practice, SMA is generally used to analyze long-term price movements. SMA displays a visual line that is formulated from simple calculations, inputing a list of prices from the highest, lowest, opening, or closing prices, then how long the period is specified.
Meanwhile, EMA tends to be more responsive to price changes and places greater position and significance on the most recent data points. EMA is regarded to be more sensitive to recent price changes than the Simple Moving Average. New data carries more weight, and the EMA responds more quickly to price changes than the SMA.
See Also:
Two Alternative Indicators For Trend Trading
As time progressed, more and more trend indicators began to appear as alternatives to Moving Average. Traders now have more choices to determine market trends. Among the many options, here are two of the most promising technical indicators to substitute Moving Average:
ATR Stop
ATR Stop is suitable to complement Moving Average because of its accuracy in following the trend. The advantage lies in the use of ATR, so the trendline display helps you measure very high changes in the price movement. In other words, ATR Stop can be used by all traders, from scalpers to swing traders.
ATR Stop combines information from ATR to follow the latest price movement trend according to the average volatility of an asset. The average volatility is then modified by the ATR Stop coefficient to form a line that move along the price movement. The position indicates the current dominant trend, where a declining ATR Stop above the price shows a downtrend while rising ATR Stop below the price underlines an uptrend. That way, ATR Stop can be used as dynamic support and resistance boundaries.
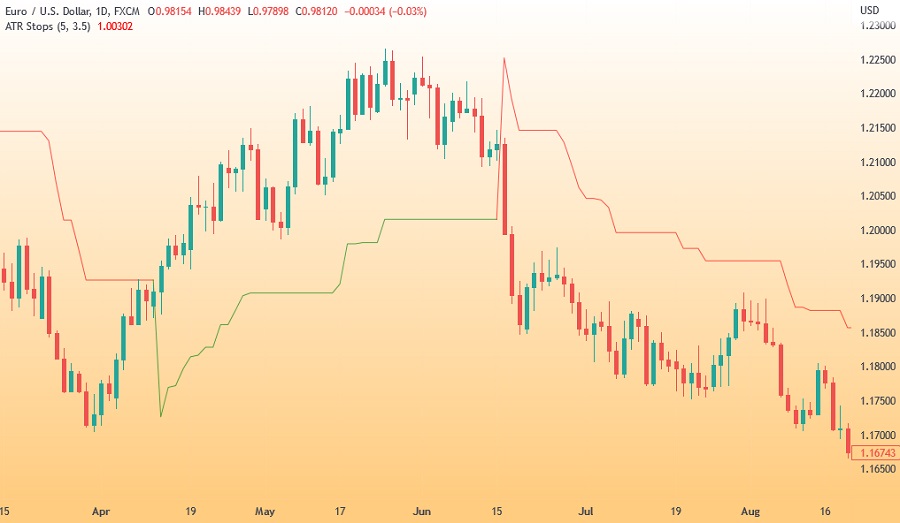
In addition, ATR Stop can function as a trailing SL because it uses volatility to measure the price movement. By doing so, traders can get the most out of trending markets with ATR Stop.
An interesting fact is that ATR Stop should not be used to look for buy or sell signals because this indicator only provides the range of the price movement in a certain period of time. This is why ATR Stop cannot be used as a single indicator but must be combined with other trading strategies.
MA Envelope
MA Envelope is one of the default indicators provided by MT4. It uses the average value of price movements that have occurred in the market. Apart from being an alternative, this indicator can be used in conjunction with the Moving Average.
The advantage of the MA Envelope compared to conventional Moving Averages is that it is easy to isolate trend movements. The price used as a benchmark in the MA Envelope is the percentage of the highest price and the percentage of the lowest price; it is then depicted in 3 lines that wrap around the price movement.
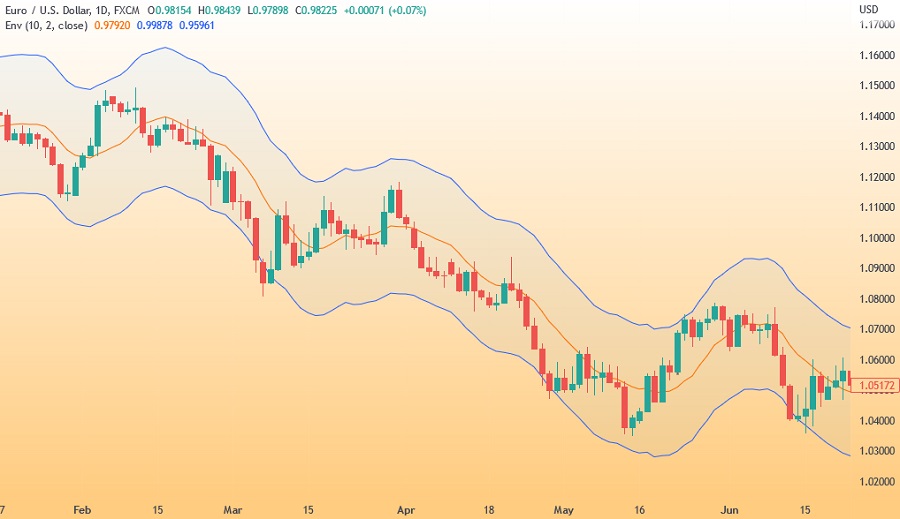
The key to the MA Envelope is to pay attention to the price uptrend that moves from the middle line to break the upper line. If during an uptrend there is a pullback (retracement) under the middle line, be careful of the possibility of a bearish reversal. During the downtrend, the price moves from the middle line to break the lower line. If during the downtrend there is a rally that supports the price to rise past the red line, be careful of a bullish reversal.
That's a review of the two interesting options for trend trading. The conclusion is that the Moving Average indicator can be a choice in a trading strategy, but there's no harm in trying other indicators like ATR Stop and MA Envelops.
There is one important thing for you to remember. Even though the indicators above are quite easy to follow, you must still understand that there is no indicator capable of guaranteeing 100% profit. In that case, applying good risk management is a must for every trader to achieve consistency in the long term.
Good luck!