 Dedicated FREE FOREX VPS
 Free FOREX Virtual Private Server
 MT4 Demo Contest, Get $500
 Sign Up for an Account, Claim 60% Deposit Bonus
 Free MT4/MT5 VPS 2024
 Send E-mail and Get Free Merchandise
 $1K Refer a Friend Bonus for Pepperstone Pro clients
 Maximize Your Earnings with 100% Deposit bonus
 Trade to Win, $5,000 Monthly Demo Contest
 Claim 30% + 15% Deposit Bonus from LiteFinance
Trading with the moving average can sometimes be confusing because there are so many periods to choose from. But there's a particular moving average setup that may suit a 1-hour chart strategy.

Day trading in a 1-hour chart requires continuous feedback on short-term price action to make quick trading decisions on whether to buy or sell. Intraday bars enveloped in various moving averages perform this function thus making it possible to carry out a quick analysis that points out existing risks along with the best entry and exit points. These averages also function as macro filters by informing the trader of the best time to refrain from executing any trading action and wait for more favorable conditions.
Understanding a Moving Average
The calculation of moving averages is done to pinpoint the support and resistance levels of an asset or to determine the direction of its trend. A moving average is generally known as a lagging or trend-following indicator since it is based on previous prices. The longer the period for the moving average, the higher the lag.
Depending on their trading objectives, traders can adopt different periods of varying lengths to calculate moving averages. For example, long-term traders will adopt longer moving averages while short-term traders will adopt shorter moving averages. This means a trader using the 1-hour chart will undoubtedly adopt shorter moving averages.
Selecting the right moving average offers added reliability for all day trading strategies that are based on technical analysis while poor or misaligned settings reduce the effectiveness of otherwise profitable approaches. Most times, identical settings tend to be more effective in short-term time frames as they enable necessary modifications through the chart's length alone.
Based on this uniformity, an identical set of moving averages will be suitable for scalping techniques as well as for buying in the morning and selling in the afternoon. With that being said, the best moving average for a 1-hour chart is a combination of the 5-8-13 moving averages which we will be examining next.
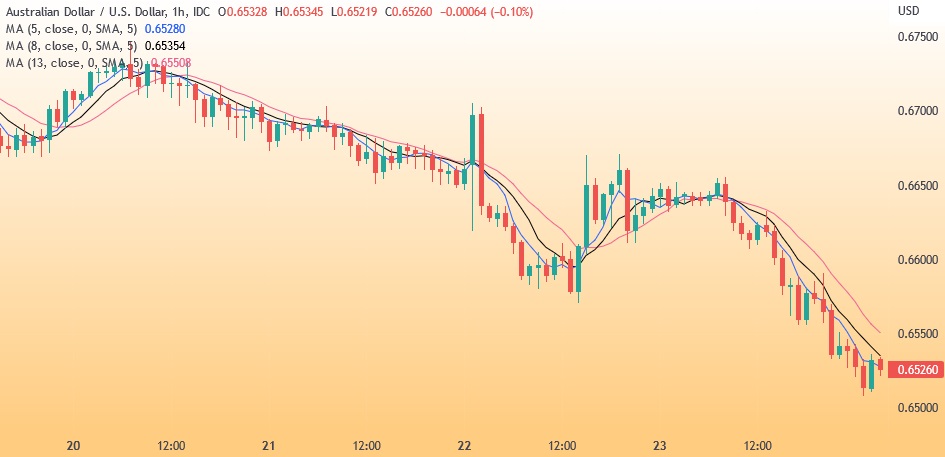
5-8-13 Moving Averages
Combining 5-, 8-, and 13-bar simple moving averages provides a perfect fit for traders using the 1-hour chart. This is because they have Fibonacci-tuned settings that have proven to be highly effective over time although traders need interpretive skills to make optimal use of the settings. It is a visual process that involves evaluating the relative connection between moving averages and price as well as moving average slopes that illustrate delicate changes in short-term momentum.
Increases in observed momentum provide buying opportunities for traders using the 1-hour chart while reductions in momentum are indications of timely exits. The process also covers sideways markets by informing the trader of when to refrain from trading, especially when the trend is weak and there are limited trading opportunities available.
The interrelationships between moving averages and price indicate periods of adverse opportunity-cost which inform traders that they should preserve speculative capital. Trendless markets and periods of high volatility tend to force 5-, 8-, and 13-bar simple moving averages into large-scale whipsaws. This brings about frequent crossovers and horizontal orientation which informs traders using the 1-hour chart to stand aside and wait.
In trendless markets, trading ranges contract while they expand in volatile markets. However, in both cases, moving averages will display corresponding characteristics that advise traders to be cautious with day trading positions. These are defensive attributes that traders should memorize and use as an overriding filter for short-term strategies.
Final Words
While it is impossible to perfectly predict the future price movements of a particular asset, combining adequate research with technical analysis can help traders make better predictions. A moving average that is rising signals an uptrend in the price of an asset while a falling moving average signals a downtrend.
5-, 8-, and 13-bar simple moving averages provide excellent inputs for traders that are looking for an extra advantage in trading the market from both long and short sides. The moving averages function as excellent filters by indicating to traders when the risk is too significant for intraday entries.


2 Comments
Javier
Jan 12 2024
The article mentions that a moving average is commonly referred to as a lagging or trend-following indicator due to its reliance on past prices. The extended duration of the moving average period results in a greater lag.
Hey, I'm curious about what "lagging" means in the context of the article discussing the moving average indicator. Also, if this lag is tied to past prices, is there a possibility of predicting trends with other indicators that advance more quickly than the lag? Thanks!
Sebastian
Jan 16 2024
Interesting question there! To address your curiosity, the term "lagging" in this context implies that the moving average responds more slowly to changes in price compared to other indicators. It reflects historical data and trends, making it less responsive to rapid market fluctuations.