 Dedicated FREE FOREX VPS
 Free FOREX Virtual Private Server
 MT4 Demo Contest, Get $500
 Sign Up for an Account, Claim 60% Deposit Bonus
 Free MT4/MT5 VPS 2024
 Send E-mail and Get Free Merchandise
 $1K Refer a Friend Bonus for Pepperstone Pro clients
 Maximize Your Earnings with 100% Deposit bonus
 Trade to Win, $5,000 Monthly Demo Contest
 Claim 30% + 15% Deposit Bonus from LiteFinance
This article will cover the use of Bollinger Bands and Simple Moving Average. How can both indicators create a combo strategy? How effective is it to spot profitable opportunities?
The Bollinger Bands was developed in 1980 by John Bollinger, a technical analyst. Today, this indicator is very popular and widely used in various trading instruments including currencies. At times, the Bollinger Bands is paired with the Simple Moving Average (SMA) in one "package" as the two indicators are complementary to each other.
Both indicators have simple displays on the trading platform while providing a lot of information to traders. Both are simple and relatively easy to understand, thus, it is advisable that beginners try these related indicators first before experimenting on other more complex indicators. So, how do we use the information provided by the Bollinger Bands and SMA?
How to Set Up Bollinger Bands and SMA on a Chart
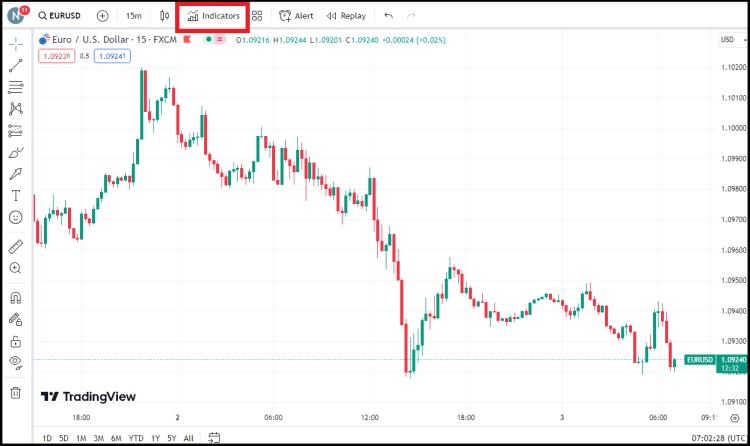
Setting up Bollinger Bands and SMA on a chart involves using a charting platform or software that supports technical indicators. Here's a step-by-step guide on how to do it on TradingView:
1. Once you have your desired trading pair or stock chart displayed, locate the "Indicators" button at the top of the chart.
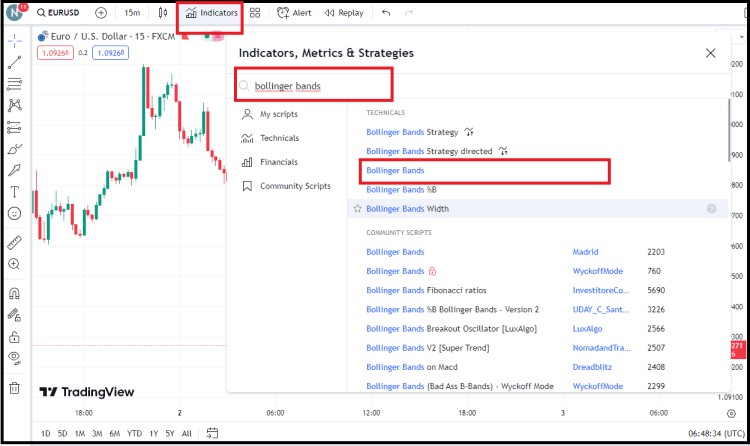
2. In the indicators window, type "Bollinger Bands" in the search bar. The Bollinger Bands indicator should appear in the results. Click on it to add it to your chart.
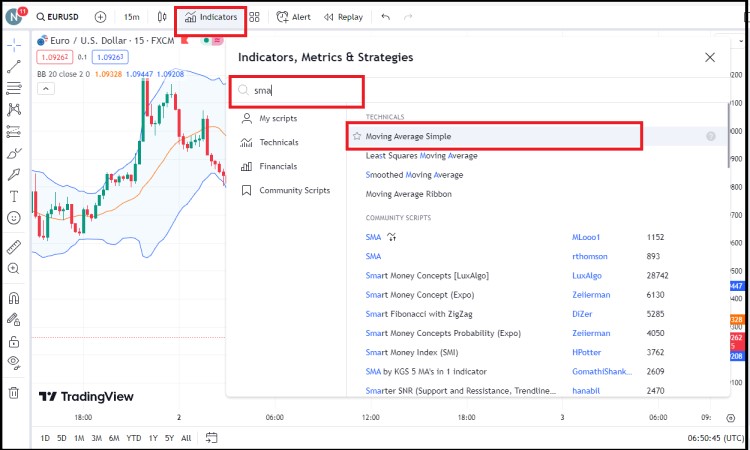
3. Next, go back to the indicators search bar, type "SMA" and click on "Moving Average Simple" when it appears in the results. You can simply click on it again to add another SMA to the chart.
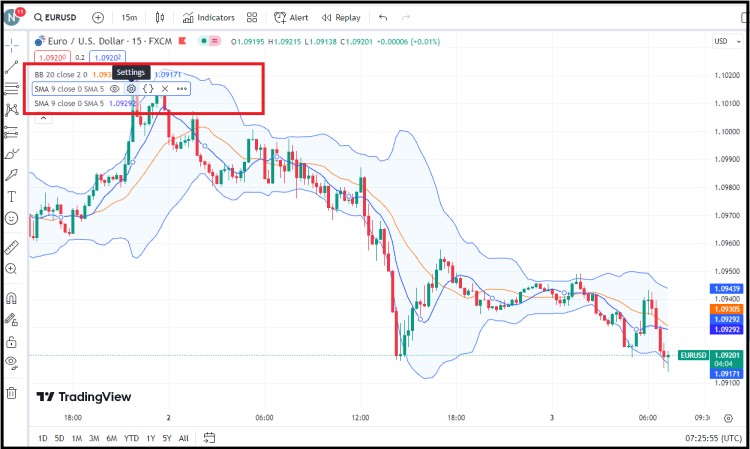
4. Once your chart appears as shown, you can adjust the indicator's configuration. Hover your cursor over the indicator in the top left corner, then click the gear icon to access the "Settings" menu.
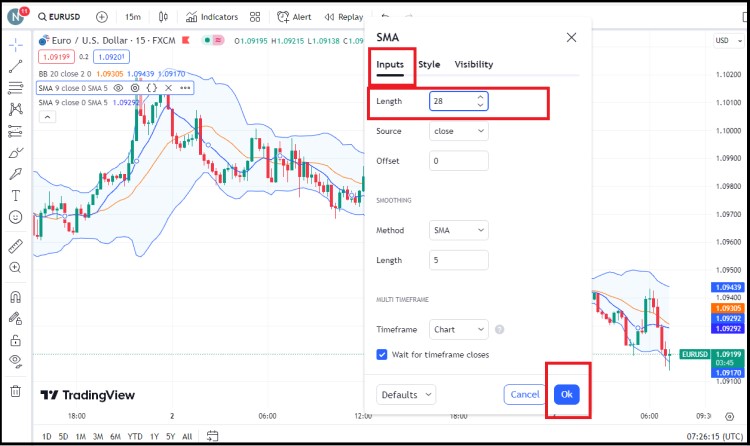
5. After that, select the "Input" submenu, and you can enter the configuration. If you want to set up SMA 28, you can change the numbers to 28, then click "OK". Do the same to set up SMA 26.
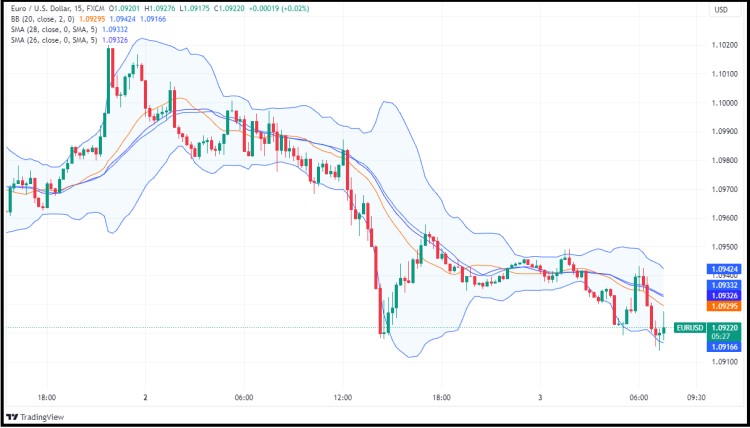
6. That's it. Your final chart will look something like this.
Combining Bollinger Bands and SMA
Bollinger Bands is better combined with other indicators that help determine the right entry point. You can use confirmators that read the price patterns or any other technical indicator.
If you prefer the latter, two SMA lines can be utilized to confirm the Bollinger Bands. We can make use of the crossing between the two SMAs as the reference to enter a position, while the Bollinger Bands is used to predict the range of support and resistance level.
The Bollinger Bands can also be used to place the Stop Loss and Take Profit levels. Let's take a look at the AUS/USD chart below that applies the combination of Bollinger Bands, 48 SMA as the slow SMA, and 26 SMA as the fast SMA line.
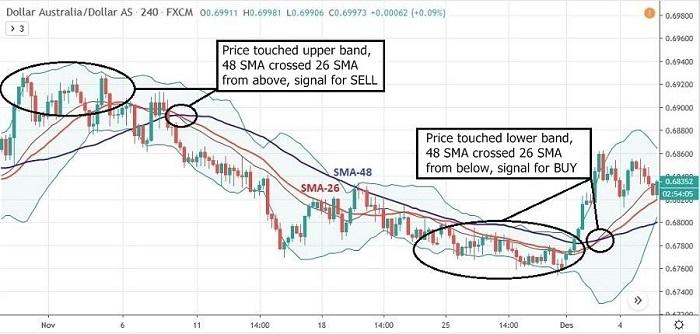
By following the rules of SMA crossing and Bollinger Bands, we can conclude that:
- If the price touches the upper band and the fast SMA crosses the slow SMA from above, it is recommended to short the currency.
- If the price touches the lower band and the fast SMA crosses the slow SMA from below, it is better to long the currency.
Pros Cons Combining Bollinger Bands with SMA
Combining Bollinger Bands with SMA can be a powerful approach to technical analysis, as it leverages the strengths of both indicators. However, like any trading strategy, it also comes with its own set of pros and cons. Let's take a look:
| ✔️Pros | ❌Cons |
|
|
Final Words
The Bollinger Bands is a technical indicator with primary functions to measure volatility and gauge trend direction. Yet, this indicator can also be used to identify whether the market is overbought or oversold, so the traders can expect when the next price reversal will occur.
The short explanation above gives you a basic idea of how to apply the Bollinger Bands and SMA in the simplest way. Every trader may have their own method to make use of the information from technical indicators.
For that, don't be shy to try and find your own best trading recipe that suits your style and needs the most. The important thing is, don't try any new strategy in a live account.
Try to use a forex demo account instead as your experiment playground so you will have no real risk when trying out new trading techniques.


2 Comments
Andy Carrol
Apr 21 2024
Hey, just checked out this piece on the Blinnger Bands and SMA Combination strategy. The author seems to be using TradingView for their trades, but I'm more into Metatrader 5. Wondering if I can still apply the same steps they outlined in the article on TradingView to my Metatrader setup. Also, between TradingView and Metatrader, which one's easier to use? Thanks!
George
Apr 25 2024
Sure thing! You bet! Even though the author uses TradingView, you can totally adapt their strategy to Metatrader 5. The concepts behind Blinnger Bands and SMA combination strategy remain the same, regardless of the platform. So, you should be good to go!
As for simplicity, many traders find TradingView easier to navigate. Its intuitive interface and user-friendly design make it a popular choice, especially for beginners. Plus, TradingView offers a wide range of features and tools without overwhelming users. So, if you're looking for simplicity and ease of use, TradingView might be the way to go. (you can try to read more about tradingview in here : Level Up Your Trading in IC Markets Global with TradingView - IC Markets Broker News)