 Dedicated FREE FOREX VPS
 Free FOREX Virtual Private Server
 MT4 Demo Contest, Get $500
 Sign Up for an Account, Claim 60% Deposit Bonus
 Free MT4/MT5 VPS 2024
 Send E-mail and Get Free Merchandise
 $1K Refer a Friend Bonus for Pepperstone Pro clients
 Maximize Your Earnings with 100% Deposit bonus
 Trade to Win, $5,000 Monthly Demo Contest
 Claim 30% + 15% Deposit Bonus from LiteFinance
There are various types of technical indicators. How should we choose the best technical indicator and apply them for profit?
Forex and Crypto traders need technical indicators to examine current price actions and predict future movements based on historical price charts. There are various types of technical indicators that are commonly used in the market, but traders are rarely able to use all of them.
Beginner traders often seek to learn as many indicators as possible. However, they will later find that it is not feasible to apply too many indicators on any chart. Experienced traders tend to choose whichever technical indicator they understand best, then optimize it to improve their trading results.
It can be said futile to learn all the technical indicators in the world. Still, there are several basic understandings that beginners have to know in order to emulate those masters.
Contents
What are Technical Indicators?
Technical indicators are tools based on mathematical and statistical theories that are used to analyze historical price data, trade volume, or buyer/seller interest in a market. By applying technical indicators, traders are able to gain a certain understanding of current market conditions as well as predict the next movement (technical analysis). Some popular examples of technical indicators are the Relative Strength Index (RSI), Stochastics, Bollinger Bands, and so on.
Forex and Crypto analysis with technical indicators focuses on historical price data, ignoring the fundamental factors that cause price changes in the same time frame. They are generally used by day traders who seek to gain short-term profit from stocks, forex, crypto, and commodities; because they are initially designed to analyze short-term price movements. However, medium and long-term traders who focus on fundamental analysis can also use technical indicators to identify buy/sell signals more precisely.
Types of Technical Indicators
There are dozens, or even hundreds, of technical indicators in the world. Any mathematician, statistician, or economist who understands the financial markets can create their own indicator. If a newly-created technical indicator shows enough accuracy, it can be disseminated to be used by traders around the world, either for free or for a certain fee.
Technical indicators can be divided into two types based on their application method: overlay and oscillator.
Overlay
Overlay-type technical indicators are usually in the form of charts that are stacked above the price chart. The most famous examples include Moving Averages (MA), Bollinger Bands (BB), Parabolic SAR, and Ichimoku Kinko Hyo.
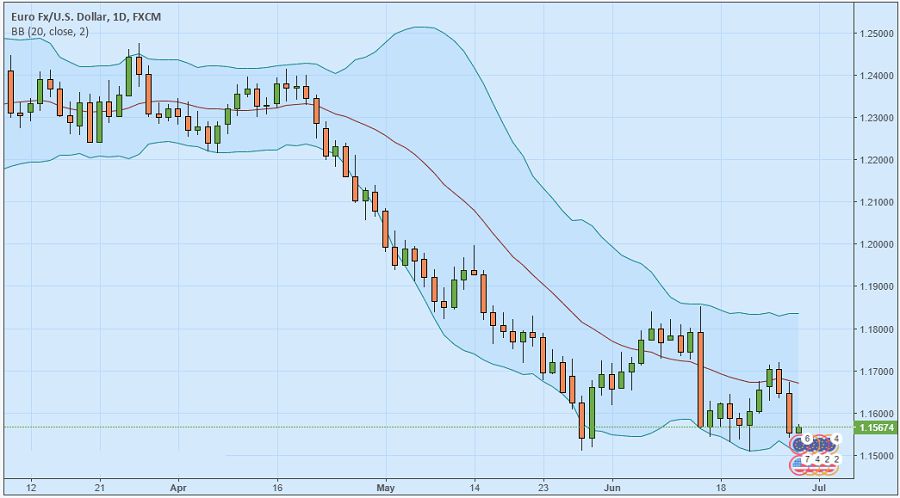
An example of an overlay technical indicator can be seen on the EUR/USD chart with Bollinger Bands below. Candlestick charts represent price movements, while line charts represent Bollinger Bands.
Oscillator
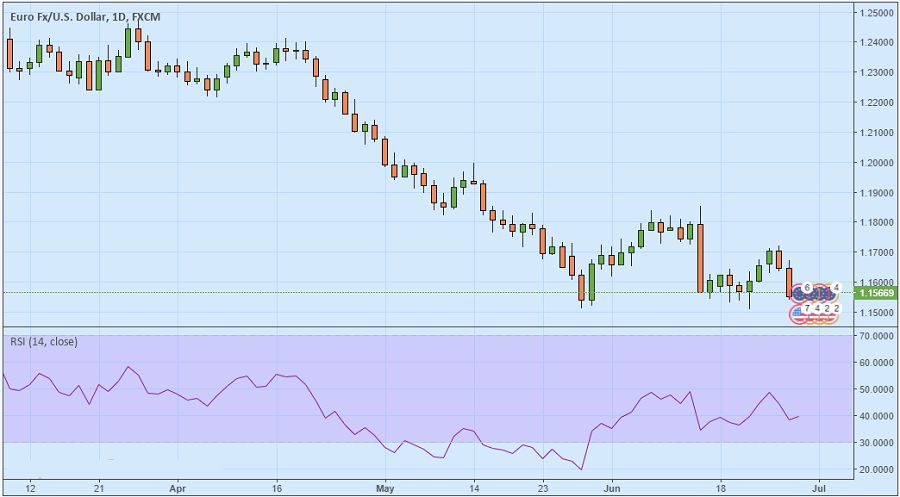
Oscillator-type technical indicators usually show up as a new chart below the price chart; they display oscillations between certain minimum and maximum values. In contrast to overlay indicators that are mainly calculated from historical price data, some oscillator-type indicators also calculate fluctuations in trade volume. Moving Average Convergence Divergence (MACD), Relative Strength Index (RSI), Stochastic Oscillator, and Money Flow Index are some well-known examples.
An example of an oscillator-type technical indicator can be seen in the EUR/USD chart with RSI below:
Choosing the Best Technical Indicator
Beginner traders usually study a variety of technical indicators one by one, then choose the most convenient and profitable for daily use. However, traders can actually use more than one technical indicator to analyze the market. Most importantly, consider these three aspects to choose the best technical indicator for you:
-
Appropriate adjustment is important.
Trading platforms usually provide several built-in technical indicators with certain default settings. However, default settings are not necessarily suitable for traders' strategies. Therefore, you should do some trial and error to adjust the settings.
For instance: Moving Average users may draw them based on the closing price (Close), the highest price (High), or others. The Moving Average itself is calculated from average prices, so you can also determine the periods such as the 50-day MA (the average price of the last 50 days), 100 MA, 200 MA, and so on.
In the EUR/USD price chart below, the red line represents the 50-day MA while the blue line represents the 100-day MA. Different parameters will result in different appearance and efficacy, although we can use any Moving Average with the same method.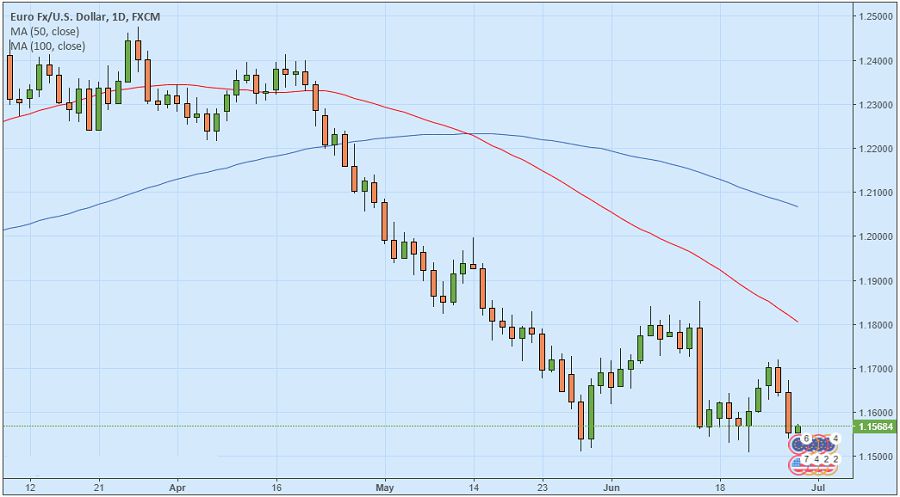
-
Combine several technical indicators with different functions.
The combination of two or more technical indicators to analyze the market must be based on the function of each indicator. Be careful not to stack too many indicators on the chart, because such action may make it difficult for you to read initial price actions.
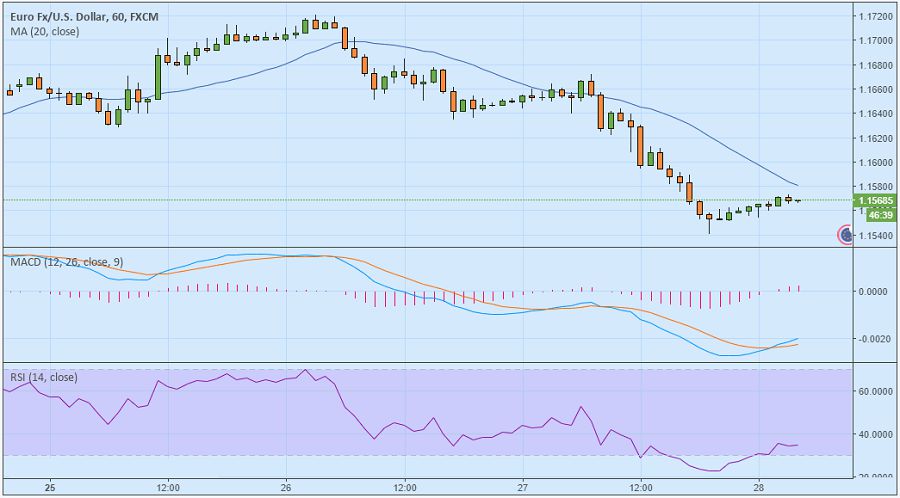
For example, below is an appropriate mix consisting of Moving Averages, MACD, and RSI:Moving Averages detect the direction of market trend. Generally, the trend is bullish (prices tend to rise) when the price chart shifts above the MA line. On the other hand, the trend is bearish (prices tend to fall) when the price chart shifts below the MA line.
MACD confirms whether MA identified the correct trend. If MA and MACD both tend to be bullish, then we should seek buy signals. Likewise, if MA and MACD both tend to be bearish, it can be concluded that it is time to sell. However, where and when should we buy/sell? MACD is not very accurate in identifying buy/sell signals, so we apply RSI to identify the best entry.
Such a combination will result in a comprehensive technical analysis set-up as shown in the following EUR/USD chart.
-
Do some simulation before using any technical indicators on real accounts.
Lastly, use a demo account to understand how any indicator works and compose your own technical analysis set-up. A demo account allows you to practice under actual market conditions with virtual funds that can be obtained for free from the broker. Thus, you gain more freedom in conducting trial and error.
Most forex brokers provide demo accounts for free, as well as several crypto and stock brokers. In case your preferred broker does not provide such convenience, you can make use of freemium chart providers such as TradingView for paper trading.