Fibonacci Calculator - A Powerful Technical Tool
The Fibonacci calculator will show you the retracement and extension levels according to the popular Fibonacci theory used in forex trading.
| Uptrend |
|
*) The highest price point according to your observations
(example: 1.35000)
*) The lowest price point according to your observations
(example: 1.31000) |
| Retracements | |
| 0% (b) | |
| 23.6% | |
| 38.2% | |
| 50% | |
| 61.8% | |
| 76.4% | |
| 100% (a) | |
| 138.2% | |
| Extensions | |
| 261.8% | |
| 200% | |
| 161.8% | |
| 138.2% | |
| 100% | |
| 61.8% | |
| 50% | |
| 38.2% | |
| 23.6% | |
| Downtrend |
|
*) The highest price point according to your observations
(example: 1.35000)
*) The lowest price point according to your observations
(example: 1.31000) |
| Retracements | |
| 138.2% | |
| 100% (a) | |
| 76.4% | |
| 61.8% | |
| 50% | |
| 38.2% | |
| 23.6% | |
| 0% (b) | |
| Extensions | |
| 23.6% | |
| 38.2% | |
| 50% | |
| 61.8% | |
| 100% | |
| 138.2% | |
| 161.8% | |
| 200% | |
| 261.8% | |
How to use Fibonacci sequence as the basis of AB = CD pattern?
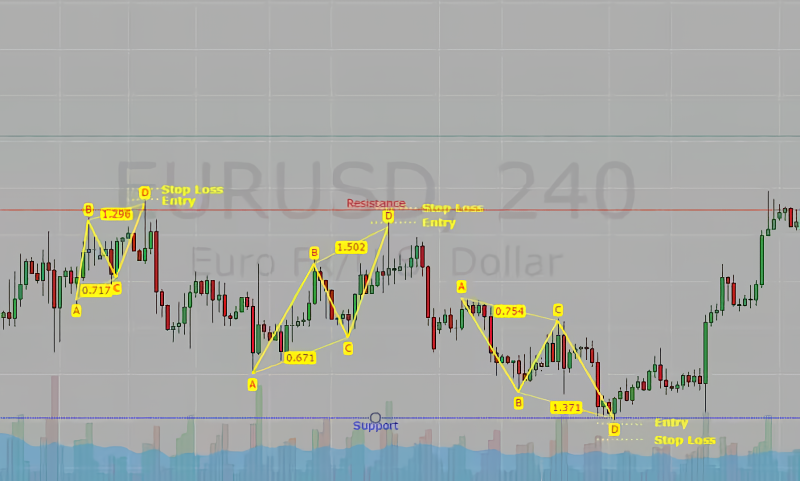
At first glance, the AB = CD pattern looks like a zigzag pattern. But keep in mind that the lines are not just drawn without certain conditions.
- The leg of the AB line is drawn from the lowest price (low) to the nearest high.
- Next, for the retracement of the AB leg, the BC line should be at the 0.38 to 0.78 retracement level (ideally at 0.68) from the AB line.
- The leg of the CD line is drawn from the low of the BC line towards the next high with a limit of 1.27 to 1.68 extension of the BC line.
Continue Reading at 5 Powerful Strategies of Fibonacci Patterns
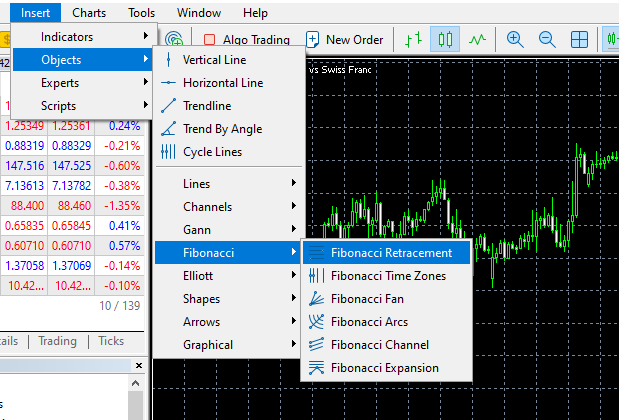
How to apply Fibonacci Retracement on a MetaTrader chart?
You can find it on the Insert menu >>> Objects >>> Fibonacci >>> Fibonacci Retracement. Drag your cursor from left to right. Click on the High or Low on the left side of the chart, then click on the High or Low on the right side of the chart.
Continue Reading at Learn How to Use Fibonacci in Financial Trading
How to apply Fibonacci Retracement as support and resistance?
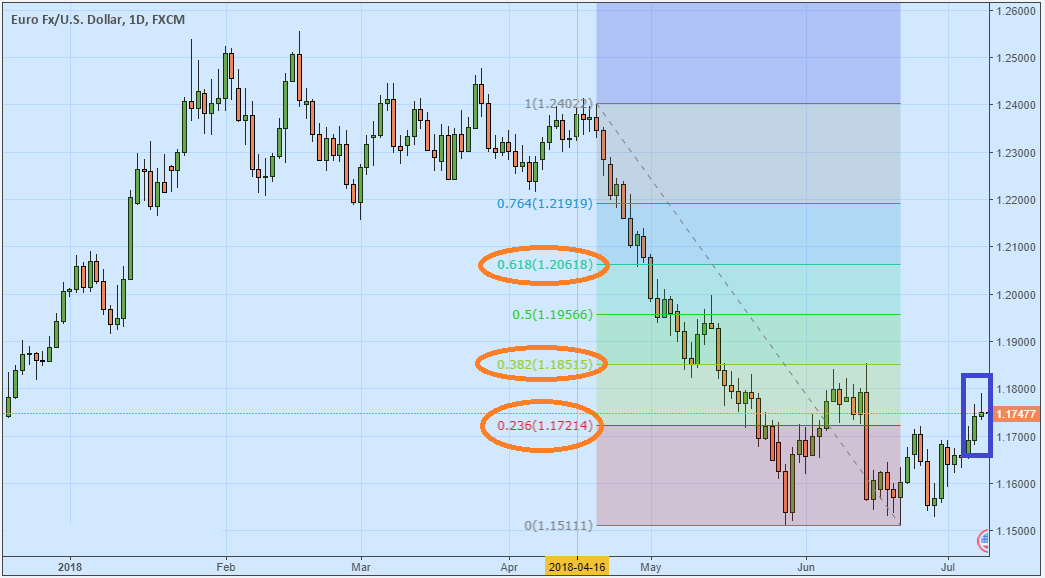
- Identify where prices move. For example in the picture below, it seems that prices are going down (bearish). In this situation, traders will look for opportunities to sell when prices temporarily retrace higher.
- Mark the horizontal lines where Fibonacci Retracement 23.6% (0.236), 38.2% (0.382), and 61.8% (0.618) are located. These lines are used to identify levels where prices are more likely to reverse.
- Observe close prices on the candle that represents price movements near the aforementioned Retracement levels. When prices have risen up to Fibonacci levels of 0.236, 0.382, or 0.618, take note of where the next candle closes.
Continue Reading at Learn How to Use Fibonacci in Financial Trading
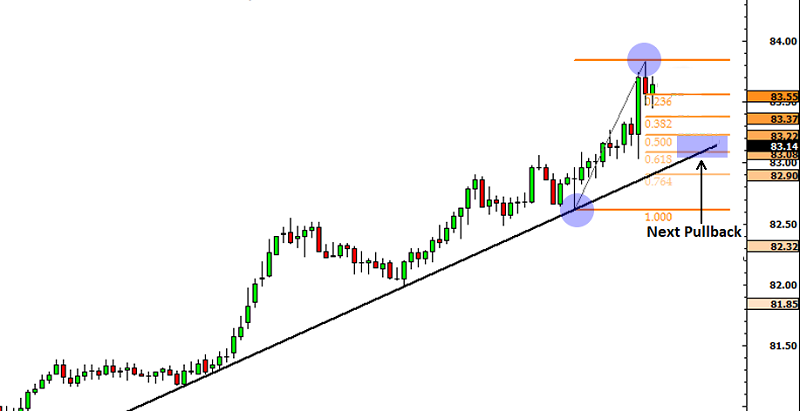
How to apply pullback strategy with Fibonacci and trendline?
- Identify the Trend: Determine whether the trend is bullish or bearish.
- Select Time Frame: To minimize price noise, it is advisable to utilize 1-hour or longer time frame.
- Determine Peak Points: Find the most recent swing high and swing low points to draw Fibonacci retracements.
- Entry at Fibonacci Levels: Look for opportunities to enter trades when there is a retracement between the 50% and 61.8% Fibonacci levels.
- Determine Exit: Set stop loss and take profit orders based on the latest swing points.
Continue Reading at 5 Pullback Trading Strategies to Try
Fibonacci Articles
-
FIBO Group App Review: Trading Made Easy for Beginners
-
Five Mistakes In Using Fibonacci Retracement
-
How to Open Account in FIBO Group
-
How to Verify Account in FIBO Group
-
5 Powerful Strategies of Fibonacci Patterns
-
How to Deposit and Withdraw in FIBO Group
-
Practical Fibonacci Retracement For Forex Trading
-
Learn How to Use Fibonacci in Financial Trading
- More
