Dedicated FREE FOREX VPS
 Free FOREX Virtual Private Server
 MT4 Demo Contest, Get $500
 Sign Up for an Account, Claim 60% Deposit Bonus
 Free MT4/MT5 VPS 2024
 Send E-mail and Get Free Merchandise
 $1K Refer a Friend Bonus for Pepperstone Pro clients
 Maximize Your Earnings with 100% Deposit bonus
 Trade to Win, $5,000 Monthly Demo Contest
 Claim 30% + 15% Deposit Bonus from LiteFinance
Did you know that market movements repeat themselves and form a constant cycle every once in a while? How do you adapt your strategy to it?

Financial markets like stock and forex are always changing from time to time. Sometimes the movements are big and could last for weeks or months, other times they are small and changes fast. The traders' job is to build a trading strategy that uses those movements in order to generate profit from the money they've risked. Thus, every trader should have the ability to understand and analyze market movements before deciding which path they want to take.
Oftentimes, the price fluctuations of a particular market are difficult to follow, let alone predict. An average person would most likely think that the movements are random at first. However, that is not necessarily true because the market actually has a regular cycle that can be tracked. If you can recognize the pattern, you will be able to trade well and produce better results.
Today, we're going to learn about the main 4 phases in the market cycle and how to take advantage of them. But before that, let's cover the basics first.
Contents
What is a Market Cycle?
Market cycles can be defined as the special patterns in the market that causes the price to move in a certain way or direction. A regular market cycle has four main stages. The changes in a market cycle can be influenced by various factors, such as human behavior, technology development, regulatory environment, and new products.
All markets have patterns that repeat themselves over time, but the cycle duration may be different for each one depending on the asset and chart used. For instance, a market cycle for scalpers may last only 10 minutes, whereas, for position traders, the market cycle would repeat every few days.
It's actually quite hard to identify the beginning or end of a market cycle because they all go through the same phases and are cyclical in nature. That being said, what you need to do is understand the characteristics of the four phases in the cycle and learn what strategies to use during each one. Gaining knowledge could make a real difference in your trading journey.
1. The Accumulation Phase
The accumulation or collection phase typically occurs after a price drop, so there is no clear trend and the price is entering a consolidation period. At this moment, traders and investors are taking the time to accumulate their shares, hence the name. In technical trading, this condition is often called "the basing period" where prices enter a consolidation time after a downtrend before moving to the upside (bullish). The price movement usually looks flat or slightly rounded. Also, the price tends to whip back and forth around the 200-period Moving Average.
Here's what it looks like on the chart.

Most accumulation phases occur when prices have dropped over the last 6 months or so. Once it's started, the phase could last anywhere from months to sometimes even years. The longer the consolidation period, the higher the chance for a stronger break out to happen once the asset is trending again.
At this phase, the price range is small and not particularly advantageous for big traders. Thus, many prefer to use the time to study the market and get ready for the next trade. However, this does not necessarily mean that ranging markets are not profitable at all. What you should do is trade within the range. This means you can go long at the lows and take short at the highs. Place a stop loss beyond the range line to minimize risks.
It is worth noting that in the accumulation phase, it's recommended to open short trades only. The reason is that we don't know for sure if the price is really entering the accumulation phase or is it just a regular consolidation within a stronger trend. If you go long, there's a chance that the price won't bounce back up and continue to move downward instead, making you lose money. Also, try to avoid opening a trade when the price is in the middle of the range because the price could easily move against your favor.
Here are the steps you could follow to open a short trade:
- Look for a flat 200-period EMA that occurs after at least 6 months of a downtrend. Then identify the highs and lows of the price range.
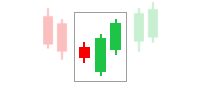
- For a short trade, wait until the price reaches the high of the range and look for a price rejection, which is typically shown by a reversal candlestick pattern like Pin Bar or Engulfing.
- Once the pattern is complete, open a short trade at the next candle.
- Place a stop loss at the high of the candle, and take profit at the nearest swing low.


2. The Advancing Phase
After the accumulation phase, the price begins to enter the advancing phase. It is characterized by the start of a new and strong uptrend, which is a great period for those who look for trading with momentum. A strong trend brings volume and new buyers to the market, presenting an excellent opportunity to make huge money. Therefore, there's a lot of euphoria sentiment happening in the market. It looks something like this.

Basically, what happens is that there's an increasing demand for the limited supply asset. As a result, the asset begins to appreciate in value. During this stage, the 200-period Moving Average moves upward, the key resistance breaks, and the price is constantly making new higher highs and higher lows.
This period can last anywhere from months to years. The beginning of the stage usually has a higher relative volume and near the end, the volatility will more likely increase due to high enthusiasm.
While the accumulation phase is defined by the price resistance to the changes in prices, the advancing phase is defined by the price going beyond the resistance level. In a trending market, the best strategy you can use is trend-following. Also, since the trend is strongly going upward, it's best to go long with your trades. There are two methods to try, namely:
1. Price pullbacks
Look for pullbacks on key levels such as:
- Moving Average
- Support area
- A resistance that turns into a Support
- Fibonacci levels
Once you find the key levels, wait until the price touches them and open a buy trade at the next candle.
2. Price breakouts
Another alternative is that you can wait until the price either break above the swing high or closes above the swing high. Once this happens, open a long buy trade.
See Also:
3. The Distribution Phase
After the price rises for a while, typically it would enter another consolidation period. This phase is also known as the early reversal phase where the uptrend is beginning to die down and buyers begin to leave the market. At this point, the volume might still be high but the buyers are not strong enough to exceed the supply and push the price higher.

During this stage, the price is contained within a range since the bulls and bears are in equilibrium. Similarly, the 200-period Moving Average also tends to move sideways and the price moves around the Moving Average line. The volatility is typically quite high due to the high interest. Most of the time, the distribution phase happens after the price have risen over 6 months or so. The phase itself can last for a variety of time ranges, starting from months to even years.
The best approach to use in the distribution phase is to trade within the range. The concept is basically similar to the strategy we use in the accumulation period. Given the location of the phase, it's best to open long trades during the distribution phase because there's always a chance that the price will continue moving upward instead of resisting.
Here are the steps you could follow to open a long trade during this phase:
- Look for a flat 200-period EMA that occurs after at least 6 months of an uptrend. Then identify the highs and lows of the price range.
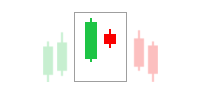
- If the price reaches the low of the range, look for price rejection which is typically shown by a reversal candlestick pattern like Pin Bar or Engulfing.
- Once the pattern is complete, open a long trade at the next candle.
- Place a stop loss at the low of the entry candle, and take profit at the nearest swing high.

4. The Declining Phase
The final phase of a market cycle is the declining or diminishing phase. This phase is characterized by the start of a new downtrend. This means that the price is starting to decline and make a series of lower highs and lower lows. During this phase, the 200-day Moving Average moves lower while the key Support level breaks. Also, the volatility is usually high because people are panicking.
Here's what the declining phase looks like on the chart.

The newly-formed downtrend shows that there's a lack of interest in the market, so it may not be the greatest time for new buyers to enter the market. However, this is not a reason to be panic and impulsively sell your assets straightaway because the phase won't last forever. This is why most traders who didn't cut loss in the previous stages typically would become long-term investors during this phase.
The best strategy to use in the declining phase is essentially similar to the one we use in the advancing phase but in the opposite way. Here, we can also use pullbacks and breakouts, only you need to go short instead of long because the market is in a downtrend.
Conclusion
Understanding how the market works and the reasons behind it will help you make better decisions with your trades and help you control your emotions. Moreover, you can now take advantage of each phase and make it profitable to you even though it may not seem like it at first.
At the end of the day, it's important to understand that change is perhaps the only certain thing about financial markets, so the ups and downs are definitely unavoidable for everyone. The best thing you could do is to use the right approach and learn to cope in different situations.
In addition to trading in four market phases, the 200 EMA can also be used as a reliable tool by combining it with other indicators to find opportunities and reap profits.