Knowing how to trade in a volatile market will assist you in choosing which currencies to trade and how to deal with them.

Volatile currency pairs are those that experience large swings in price over a short period of time. This can make them attractive to traders looking to profit from large price movements. In fact, Trading volatile currency pairs can be likened to a thrilling adventure, where every twist and turn presents new opportunities and challenges.
But volatile currency pairs can also be risky as they can quickly move against your position. To minimize such a risk, traders can trade volatile currency pairs with the assistance of technical indicators such as Bollinger Bands and Average True Range. For more details, follow the discussion below.
Trading Volatile Currency Pairs with Technical Indicators
You can use a variety of technical indicators to predict market behavior and price direction in the future. While not guaranteed, charts and indicators can assist you in developing a trading strategy and determining when to trade.
Traders must know how volatile a currency will be to establish the appropriate position size. You can measure market volatility using a variety of indicators, including:
1. Bollinger Bands
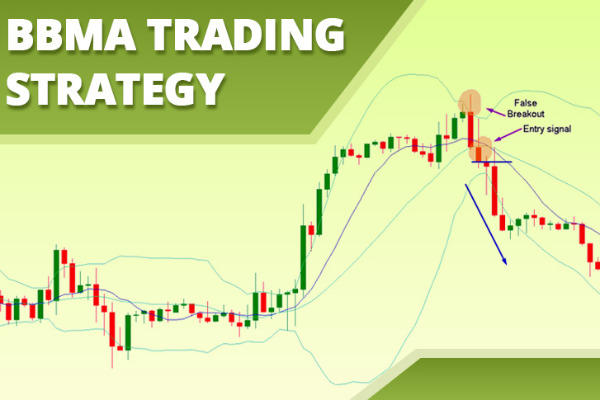
Bollinger Bands are a technical indicator that can measure market volatility. The bands widen when volatility increases and narrow when volatility decreases. Traders can use Bollinger Bands to identify periods of high and low volatility, overbought and oversold conditions, trend reversals, and support and resistance levels.
Traders can use Bollinger Bands to identify periods of high and low volatility. When the bands are vast, the market is volatile, and prices will likely fluctuate more significantly. When the bands are narrow, it indicates that the market is less volatile and prices are likely to move more slowly.
Bollinger Bands can also be used to identify overbought and oversold conditions. A security is considered overbought when the price trades above the upper band. This indicates that the market is pricing in too much optimism and that a correction may be short.
A security is considered oversold when the price trades below the lower band. This indicates that the market is pricing too much pessimism and that a rally may soon.
Here is a summary of how Bollinger Bands can be used to measure market volatility:
- Wide bands: indicate high volatility
- Narrow bands: indicate low volatility
2. Average True Range
The Average True Range (ATR) can measure market volatility. The ATR is a technical indicator that measures the average range of a security's price over a specified period. The higher the ATR, the more volatile the market is.
The ATR is calculated using the true range (TR) average over a specified period. The TR is calculated as follows:
TR = max(high - low, abs(high - close), abs(low - close))
The ATR can be used to identify periods of high and low volatility. When the ATR is high, the market is volatile, and prices are likely to fluctuate more significantly. When the ATR is low, the market is less volatile, and prices are likely to move more slowly.
The ATR can also be used to identify overbought and oversold conditions. Security is considered overbought when the ATR is high. This indicates that the market is pricing in too much optimism and that a correction may be short. Security is considered oversold when the ATR is low. This indicates that the market is pricing too much pessimism and that a rally may be short.
Some news events, such as NFP releases or Fed announcements, can significantly impact currency volatility. To anticipate the risks, traders can use an economic calendar. Keeping up with the latest currency pairs news and research can help you anticipate potential price fluctuations to assist you in understanding the market trends.
Several Trading Tips in a Volatile Market
We provide some valuable tips that you can apply when you want to trade in a highly volatile market:
- Maintain a Trading Journal
Keeping track of your deals in a trading journal is an excellent habit to get. It's beneficial when trading volatile markets because it allows you to review your trades and see what worked and what you could have done differently. Through a continuous process of self-evaluation, reflection, and progress, a well-maintained trading journal will assist you in becoming a better trader. - Stop Losses Is a Must
When trading, it's usually a good idea to utilize stop losses to reduce risk, especially when dealing with volatile currencies. Stop losses ensure that any lost transactions are accounted for ahead of time, and you may choose a degree of loss that you can afford in the worst-case situation. - Reduce The Size Of The Position
There is the possibility for enormous winnings in fluctuating forex markets, but there is also the potential for significant losses. Any trader would do well to keep their position size small when facing high volatility in the market. We recommend you risk no more than 5% of your account on open trades. This action will give your position more room to maneuver without losing your funds too quickly. - Stick to Your Forex Trading Plan
Make sure you have a trading strategy in place and that you stick to it. You can better control the fluctuations of volatile markets if you stick to your trading plan. You can manage unpredictable markets and trade more regularly using the ideas in this article and following your trading plan.
The Most Volatile Currency Pairs in the Forex Market
The most volatile currency pairs in the forex market can change over time, but some of the most volatile pairs in recent years include:
- AUD/JPY: This pair is known for its high volatility due to the inverse relationship between the Australian dollar and the Japanese yen. The Japanese yen falls when the Australian dollar rises, and vice versa. This makes the pair susceptible to sharp price movements. The Australian dollar/Japanese yen (AUDJPY) currency pair typically moves 90 to 120 pips daily.
- NZD/JPY: Similar to AUD/JPY, this pair is also known for its high volatility due to the inverse relationship between the New Zealand dollar and the Japanese yen. The NZD/JPY pair can move significantly daily, averaging 80 to 110 pips.
- GBP/USD: The British pound is a relatively volatile currency. The resulting pair can be volatile with the relatively stable US dollar. This is especially true during political or economic uncertainty in the UK. The British pound/United States dollar (GBP/USD) currency pair typically moves 60 to 90 pips daily.
- USD/CAD: The US dollar and the Canadian dollar are considered to be relatively stable currencies. Still, when they are paired together, the resulting pair can be volatile due to the economic relationship between the two countries. For example, when the US economy is doing well, the US dollar tends to appreciate, which can put downward pressure on the Canadian dollar. The USD/CAD pair can move significantly daily, averaging 50 to 80 pips.
- EUR/USD: The Euro and the US dollar are the two most traded currencies in the world, and when they are paired together, the resulting pair can be quite volatile. This is especially true during political or economic uncertainty in Europe or the United States. The Euro/United States dollar (EUR/USD) currency pair typically moves 40 to 70 pips daily.
It is important to note that volatility is not always a bad thing. Some traders prefer to trade volatile currency pairs because they offer the potential for larger profits. However, volatility can also lead to larger losses, so it is important to use risk management strategies when trading volatile currency pairs.

 Dedicated FREE FOREX VPS
 Free FOREX Virtual Private Server
 MT4 Demo Contest, Get $500
 Sign Up for an Account, Claim 60% Deposit Bonus
 Free MT4/MT5 VPS 2024
 Send E-mail and Get Free Merchandise
 $1K Refer a Friend Bonus for Pepperstone Pro clients
 Maximize Your Earnings with 100% Deposit bonus
 Trade to Win, $5,000 Monthly Demo Contest
 Claim 30% + 15% Deposit Bonus from LiteFinance


