Dedicated FREE FOREX VPS
 Free FOREX Virtual Private Server
 MT4 Demo Contest, Get $500
 Sign Up for an Account, Claim 60% Deposit Bonus
 Free MT4/MT5 VPS 2024
 Send E-mail and Get Free Merchandise
 $1K Refer a Friend Bonus for Pepperstone Pro clients
 Maximize Your Earnings with 100% Deposit bonus
 Trade to Win, $5,000 Monthly Demo Contest
 Claim 30% + 15% Deposit Bonus from LiteFinance
There are two distinctive ways in trading a double bottom pattern. Both are strategies that take advantage of reversals, particularly the bullish one.
Many experts believe that using the Double Bottom pattern, especially for a reversal strategy, can be very helpful. Anyone with basic knowledge of trading can get into and learn about it. A strong reversal can be a fight-or-flight cue for many experts who maintain their actions in intermediate and long time frames. That is why many traders take a Double Bottom pattern as one of the main indicators when "something important will happen".
See Also:
First, it is noteworthy to categorize the Double Bottom as a bullish reversal pattern. As the name suggests, it is made up of two bottoms or lows that reach an equal level and goes moderately higher as a peak between them. This can be found in major chart types, including candlestick, P&F, and line chart, although with different interpretations.
When used in a candlestick chart, the classic Double Bottom pattern usually shows an intermediate or even long-term change (reversal) in trend. It can form during a downtrend that may risk the key resistance being broken. And since it is considered a bullish signal, this pattern can only be noticed if we look at the longer time frame, to see if the market is in a downtrend or not.
How the Double Bottom Pattern Forms
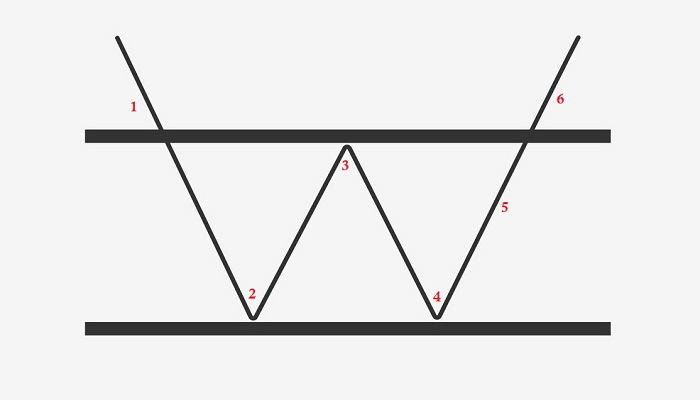
- Existing Trend – Existing trend or prior trend is the current phase of the chart when it shows a significant downtrend for weeks or even months.
- First Low – The first low occurs when the trend goes down to the lowest point. Once this happens, the downtrend will remain with a slight chance of going even deeper.
- Peak – However, after the first low is reached, the reversal signal kicks in, and the trend advances back up, but with limited volume, usually between 10% and 20% climb. This increase could signal an early accumulation, but it's not absolute. At this stage, buyers are considering whether to keep the momentum or wait for more dynamics in the market. Hence, they will rather scale down their actions, and the chart reaches its peak.
- Second Low – When the reaction declines, the market sees low volume. Then, sellers get into the market and push the price down once again, touching the previous support level. At this point, the Double Bottom pattern is formed. The space between the two lows can vary, from a few weeks to many months (usually 1-3 months). The tips of the two lows mark a strong resistance level.
- Advance – Unlike the Double Top, the Double Bottom pattern considers volume more important to confirm the reversal. There should be strong evidence that volume and buying pressure are powering up during the advance phase. If confirmed, then the chart accelerates, ascends with small gaps here and there, and keeps the sentiment for at least a few weeks.
- Resistance Break – The Double Bottom pattern is confirmed when the price breaks out of the resistance line or the previous peak. Once this happens, the current price is higher than the highest point between the two lows. And just like advances, this also occurs with an accelerated ascent and increase in volume.
How to Trade Reversals with the Double Bottom Pattern
So, here's how to trade reversals with Double Bottom Patterns. To use the Double Bottom pattern correctly, you have to first understand your preferred trading style, risk aversion, and future projections about the market. Once you know this, it is time to take the certain rules that apply to your trading style. Now, here are two main groups of actions you could take to utilize the Double Bottom pattern based on trading styles and preferences.
Conservative Entry
It is important to remember that the Double Bottom reversal is categorized as an intermediate to a long-term reversal pattern. So, similar-looking patterns cannot be confirmed as such when it forms in only a few days. And although a few-week time is compatible for it to form, it is safe to have at least 3 to 4 weeks between the two lows to confirm it. It is also important to note that lows take longer to form than peaks. So, it is wise to be patient and wait for confirmation before taking any significant action. Look at how the pattern grows and develops during the time frame.
Here are some rules if you take the conservative way:
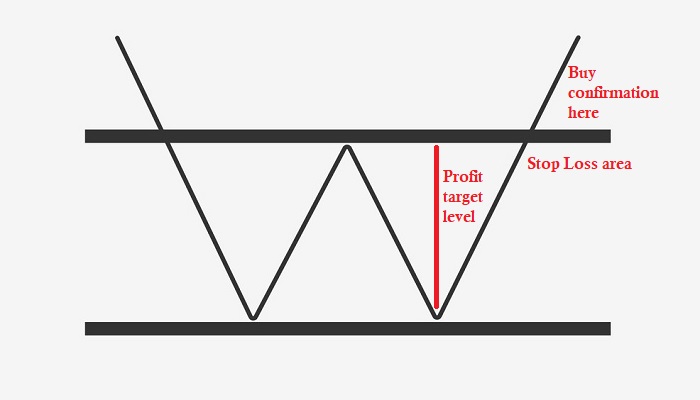
- Wait for the price to break above the peak level. One way to do this is by making sure the candlestick that breaks must close above the peak.
- Place a Buy order above that breakout high.
- Then place your Stop Loss anywhere just slightly below the peak.
- Take profit by calculating the distance between the peak and the 1st or 2nd bottom, and measure it in pips. Use that number to calculate the potential profit.
Aggressive Entry
If you are a more aggressive type of trader, there's no need to wait for the confirmation after the Double Bottom pattern to say that it is what it is. Once the price breaks out above the neckline, then you are good to go.
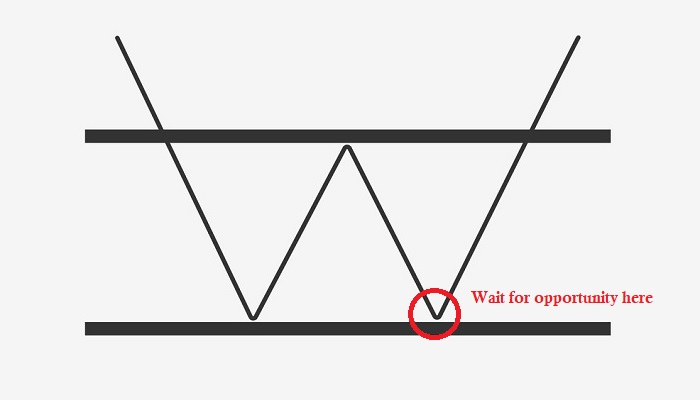
When you are trying to enter the market early before your peers, it is important to take into consideration that the starting point to place a Buy order is when a second bottom forms. The goal, of course, is that when the price goes up and breaks out, you can earn a significant profit by buying at the lowest point.
Here are some key notes to using a Double Bottom pattern the aggressive way:
- Once the 2nd low forms, you can watch out for a bullish reversal to form.
- Place a Buy Stop order above the high of the reversal.
- Then, place a Stop Loss action a few pips below the low of the bullish reversal.
- Take profit by using the previous resistance as the price target level.
So, that's how to trade reversals using the Double Bottom pattern. Yes, it can be tricky at first and may require a bit of patience, especially for medium to long-term confirmation. It is noteworthy that every pattern should be confirmed using the previous data, technical analysis, market sentiments, and of course, your personal calculation.