Pivot Point Calculator - Key Levels for Technical Analysis
The Pivot Point Calculator will show you support and resistance levels based on the pivot point formula.
Guide to use the Pivot Point Calculator
- Decide on the type of Pivot Point that you want t o calculate. You can choose between Classic, Woodie's, Camarilla, and De Mark. When in doubt, just go for Classic.
- Enter the highest price level, lowest price, and closing price in the columns provided. This price level corresponds to the time frame you choose. If you use a daily chart, then enter the highest price, lowest price, and closing price of the previous day.
- For De Mark Pivot Point, you need to add an opening price.
- Click "Calculate".
How to calculate pivot points?
Pivot points can be calculated daily based on the High and Low of the previous day. You can also count it weekly based on the High and Low of the previous week. In some cases, pivot points can even be calculated monthly. Day traders typically use daily pivot points, whereas swing traders typically make use of daily and weekly pivot points.
In short, you can calculate the pivot point by using the following formula:
Pivot Point = High + Low + Close / 3
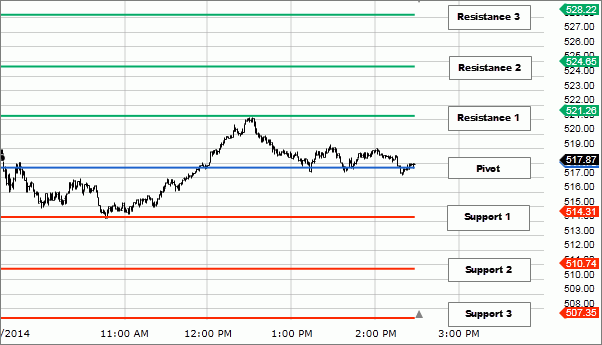
You can then draw the accompanying support and resistance levels with the formula below:
- Resistance 1 (R1) = (2 x Pivot Point) - Low
- Support 1 (S1) = (2 x Pivot Point) - High
- Resistance 2 (R2) = Pivot Point + (High - Low)
- Support 2 (S2) = Pivot Point - (High - Low)
- Resistance 3 (R3) = High + 2 x (Pivot Point - Low)
- Support 3 (S3) = Low - 2 x (High - Pivot Point)
Continue Reading at Your Definitive Guide to Pivot Points in Forex Trading
What are the important points to understand about pivot points?
Four things about pivot points you need to understand are:
- How to calculate pivot points
- How to measure pivot point accuracy
- Setting stop loss and take profit with pivot points
- Combine pivot points with oscillators
Continue Reading at Your Definitive Guide to Pivot Points in Forex Trading
How to calculate pivot point levels?
Pivot point levels are generated by a specific formula that calculates the past price levels to determine potential turning points in the chart. Pivot points use the previous day's Open, High, and Low to calculate the points for the current day. Traders often see these pivots as markers for support and resistance levels. In forex trading, pivot points are often used by day traders who prefer shorter time frames.
Pivot points can be accurate and objective, but compared to psychological levels or price swings, the accuracy of pivot points as support and resistance levels is relatively low. When the market experiences high volatility and the price moves very fast, pivot points are usually incapable of indicating the right key levels.
Continue Reading at Support and Resistance Levels: The Complete Guide
How to use pivot points with moving average fakeout?
An example of Moving Average fakeouts consists of three Simple Moving Averages (SMAs), they are 14-period, 30-period, and 50-period SMAs. A buy signal appears when the pivot points of all three SMAs are sloping upward, and prices have pulled back to the 14-period SMA without dropping below the 30-period SMA. Traders then may go long when prices move above the lowest previous high beyond the 14-period SMA, as shown below.
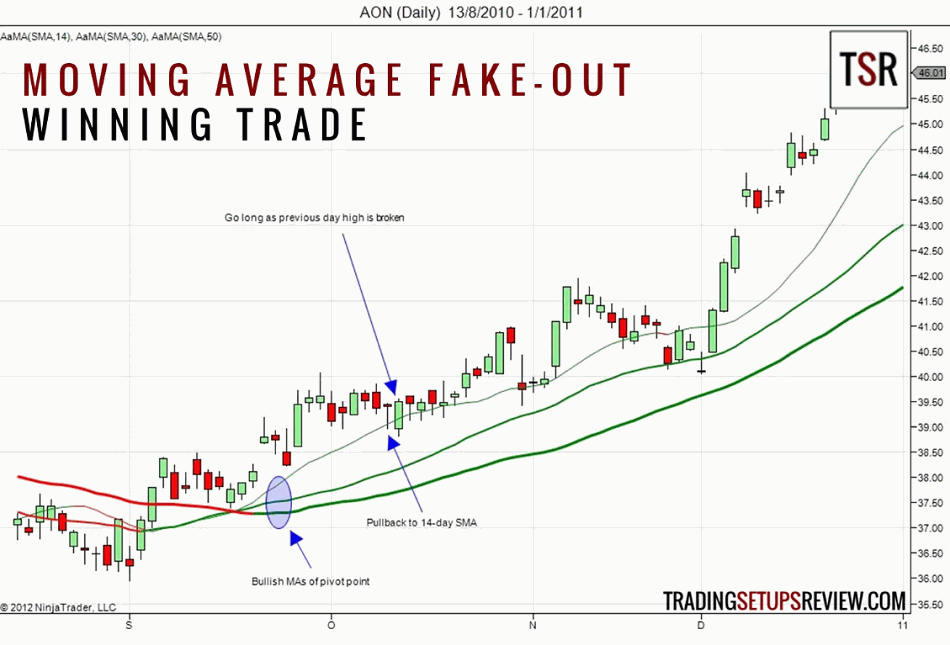 In the other direction, a sell signal appears when the pivot points of all three SMAs are sloping downward, and prices have gone up to the 14-period SMA without going over the 30-period SMA. Traders then may go short when prices move below the highest previous low under the 14-period SMA.
Continue Reading at Are Moving Average Fakeouts Tradable?
Pivot Point Articles
-
OCO Order Strategy, How Does It Work?
-
Your Definitive Guide to Pivot Points in Forex Trading
-
Supply and Demand Zones for Beginners Trading
-
Predicting Trends Using Moving Averages In Forex Trading
-
4 Forex Trading Styles in a Nutshell
-
Stop Loss Hunters: 3 Facts That May Surprise You
-
5 Ways You Can Step Up to Advanced Trading with Tickmill
-
How to be a Professional Day Trader
-
How to Day Trade with Three-Bar Reversal Pattern
-
Support and Resistance Levels: The Complete Guide
- More
