Dedicated FREE FOREX VPS
 Free FOREX Virtual Private Server
 MT4 Demo Contest, Get $500
 Sign Up for an Account, Claim 60% Deposit Bonus
 Free MT4/MT5 VPS 2024
 Send E-mail and Get Free Merchandise
 $1K Refer a Friend Bonus for Pepperstone Pro clients
 Maximize Your Earnings with 100% Deposit bonus
 Trade to Win, $5,000 Monthly Demo Contest
 Claim 30% + 15% Deposit Bonus from LiteFinance
What makes the 200 SMA strategy so special? How to trade it easily if you're a beginner? This article explains 200 SMA as a trend indicator and its combination with 50 SMA.
SMA stands for Simple Moving Average which is utilized as a trend indicator and also to pinpoint support and resistance levels. Essentially, the Simple Moving Average (SMA) is defined as the average price over a particular set of time periods. As such, the 200 SMA strategy deals with the average price of an instrument over a period of 200 days or almost 40 weeks. It is widely regarded as a primary indicator by market analysts and traders as it is useful for identifying overall long-term market trends. The indicator is seen as a line on a chart and drifts higher and lower with respect to the longer-term price movement of an instrument.

Generally, markets tend to react strongly to the 200-day SMA due to the level of importance attached to it by a lot of traders and market analysts and this is why as a trader, you cannot ignore its significance especially if you are interested in long-term trading. It enables traders to identify important levels in the forex market so that they can adapt and make adequate trading decisions in response to changes in the market.
Sometimes, the 200-day SMA appears to either serve as a support level when the price is above the Moving Average or a resistance level when the price is below the Moving Average.
It is worth pointing out that Simple Moving Average is a lagging indicator which simply means that it does not forecast the direction of price movement but simply supplies data on where the price has been. Also, to get the best result from this trading strategy, it should be applied in markets that trend strongly.
200 SMA as a Trend Indicator
The 200-day SMA strategy is mostly used to determine the general trend of a market. Once the price of an instrument being traded remains above the 200-day SMA on the daily time frame, it indicates that the instrument is in an upward trend and vice versa. In other words, the 200-day SMA can provide traders with an idea of the direction in which a trend is moving.
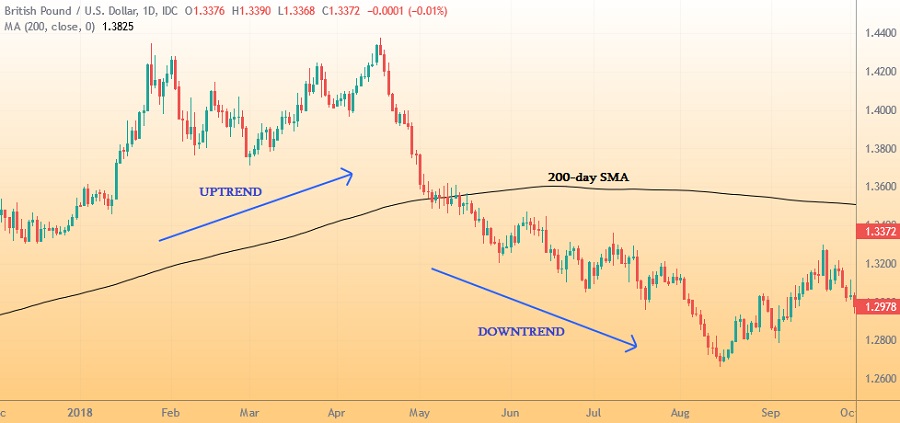
Whenever the market is in an upward trend, traders usually go long even as the price bounces off the 200-day Simple Moving Average. In contrast, when the price is below the 200-day SMA, then the trader should look for opportunities to sell the instruments they are trading. For a market in an upward trend, a stop can be placed below the 200-day indicator while in a downtrend market, the stop loss should be placed above the indicator.
Some traders decide to seek more confirmations after identifying the trend with the 200-day SMA. This is mostly to examine how strong the trend is. This is considered necessary because a weakening trend might be indicating that a trend reversal is about to occur and it provides the perfect time for exiting a current position or trade that is open. Incorporating shorter-term moving averages like the 20-day, 50-day, and 100-day SMA enables traders to determine if the current trend is getting weaker or stronger. This is made possible because shorter-term SMAs allow traders to monitor the latest price movements over a short period of time.
To take full advantage of the 200-SMA, you need to give the trade enough room to play out and don't apply a stop loss that is too tight, or else you will be missing out on potential profits. You just need to give the trade a buffer by trailing your stop loss. Otherwise, you only exit the trade when the price closes below the 200-SMA if you are in a long position, or close a position above the 200-SMA if you happen to be in a short position.
200 SMA Strategy with 50 SMA
As a result of being a very long-term Moving Average, the 200-day SMA tends to be used in combination with other shorter-term Moving Averages to not only indicate the market trend but also to examine the strength of the trend which is shown by the distance between the Moving Average lines. A good example of the short-term SMA that is commonly used with the 200-day SMA is the 50-day SMA.
When there is a convergence between Moving Average lines, it sometimes shows that there is an absence of well-defined market momentum. However, an increasing distance between shorter-term Moving Averages and longer-term Moving Averages shows an increase in trend strength as well as an uptick in market momentum.
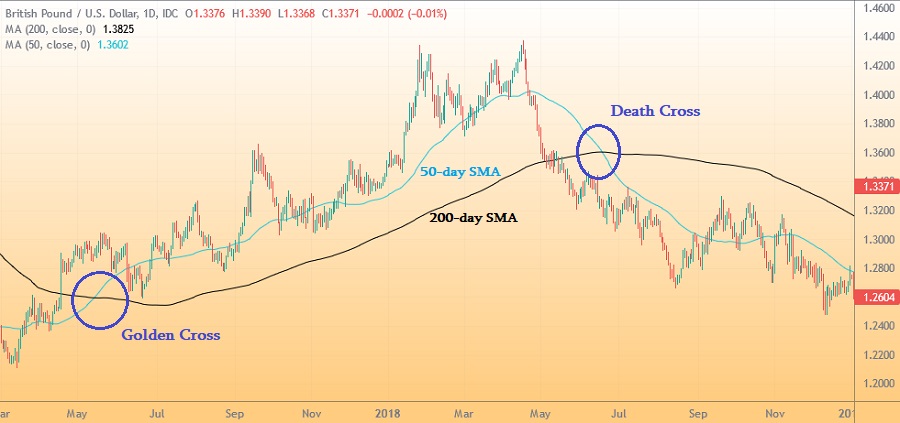
Death and Golden Crosses
Due to the importance attached to the 200-day Simple Moving Average, whenever market movement occurs such that the 50-day SMA crosses to the downside of the 200-day SMA, it is known as the "death cross" which indicates that there is about to be a bearish movement in the market of an instrument being traded. On the other hand, if it happens that the 50-day SMA crosses over to the upside of the 200-day SMA, then it is referred to as the "golden cross" which indicates a bullish movement in the market. In other words, the instrument is "golden" since the price is most likely to rise as a result of this event.
When applied effectively, this Simple Moving Average opens up trading opportunities that traders can capitalize on to earn a substantial profit. It is quite useful and the more you use it as a trader, the better you will get at it because it is not extremely complicated when compared to some other trading strategies. Keep in mind that you cannot be timid if you want to use this indicator and you cannot be reckless either. Find a balance and maximize the potential that this indicator offers.
There is another type of Moving Average apart from the Simple Moving Average called the Exponential Moving Average (EMA). Just like how 200 SMA is considered important, the 200 EMA is the center of many trading strategies. Some examples can be found in 3 Best Strategies to Use with 200 EMA.