 Dedicated FREE FOREX VPS
 Free FOREX Virtual Private Server
 MT4 Demo Contest, Get $500
 Sign Up for an Account, Claim 60% Deposit Bonus
 Free MT4/MT5 VPS 2024
 Send E-mail and Get Free Merchandise
 $1K Refer a Friend Bonus for Pepperstone Pro clients
 Maximize Your Earnings with 100% Deposit bonus
 Trade to Win, $5,000 Monthly Demo Contest
 Claim 30% + 15% Deposit Bonus from LiteFinance
Crypto trading is pretty risky if the trader doesn't use the correct approach. Here we're going to talk about the best trading indicators for crypto traders.
In crypto trading, there are many indicators or patterns that traders can choose, but there is no particular indicator that can fit all market conditions.
There are simply too many factors that can affect the prices and the market in general, so it is impossible to fit all of the variables in one indicator. This is why most traders like to use a combination of indicators in order to ensure that they don't catch false signals.
However, that doesn't mean the trader should fill the chart with all the available indicators out there. Sometimes, using too many indicators will only create confusion rather than help them.
So if you're going to use indicators in your trades, it's best just to use the ones that are more suited to your trading style.
Here we have summarized 3 of the best indicators for crypto traders:
- Simple Moving Average (SMA)
- Exponential Moving Average (EMA)
- Moving Average Convergence Divergence (MACD)
Let's take a look at the more comprehensive explanation below.
1. Simple Moving Average (SMA)
Moving Average (MA) is a computed average price that is fixed relative to a period. It is often called a lagging indicator because it providesed result based on previous price action or, in other words, the movement has already occurred.
This indicator can be useful to help traders interpret the price trends by analyzing the irregularities within the data.
Simple Moving Average (SMA) is one of the most commonly used MA for crypto trading. You can use it to identify the course of a current price trend without the intervention of shorter-term price trends.
The indicator will be able to consolidate the price points over a specific time period and then break it by the number of data points to exhibit a single trend line.
For example, we will use a Bitcoin price chart and a 200-day MA as shown on the chart below.
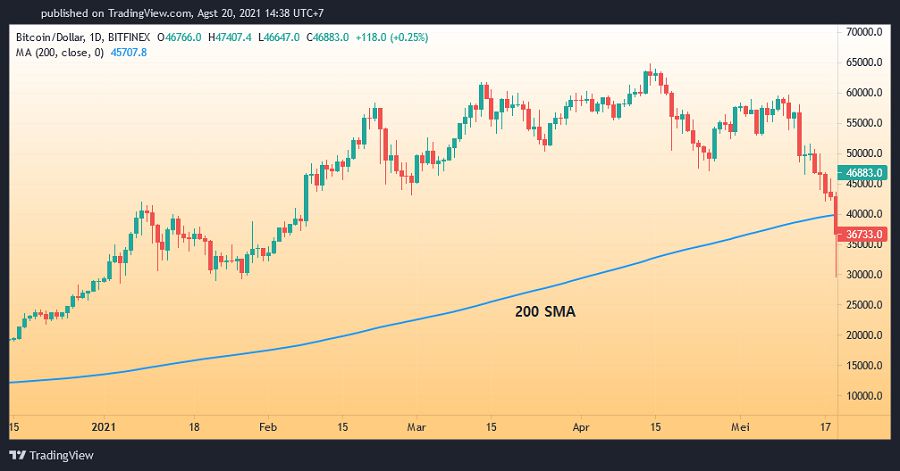
Using MA can help define a trend, and it's pretty easy to understand too. You just have to pay attention to the MA slopes.
If the MA is sloping upwards, it means that the asset is in an uptrend or gaining in price. In contrast, if the MA is sloping downwards, then it means that the asset is in a downtrend or losing in price.
The chart above shows that the slope is going steadily upwards, which suggests that the price is in a steady uptrend. Another thing to remember is that the MA moves depending on the time period that you use.
So let's say you use a 200-day MA, which means that the indicator will show you the average closing price in the last 200 days.
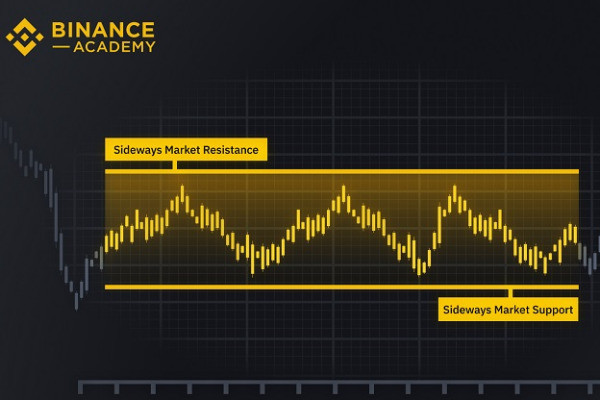
By applying the MA indicator, you can figure out support and resistance areas as well as examine the history of the asset's price. Based on that, you can also discover potential future patterns.
Essentially, there are many MA periods to choose from, but some of the most popular ones are the 20, 50, and 200-period Simple Moving Averages.
As a trader, the MA you choose should be based on your trading style. If you're a short-term trader, MA with small periods is more effective to use, while a bigger period MA is more suitable for a long-term trader.
2. Exponential Moving Average (EMA)
Exponential Moving Averages (EMA) is another famous MA type that crypto traders like to use. In terms of the calculation, EMA gives more weight to the most recent data or the newest prices.
While on the other hand, SMA puts equal weights on the price data. Therefore, EMAs tend to be more responsive to price changes compared to SMAs.
When used alongside other indicators, EMAs can assist traders in figuring out meaningful market movements and assessing their validity.
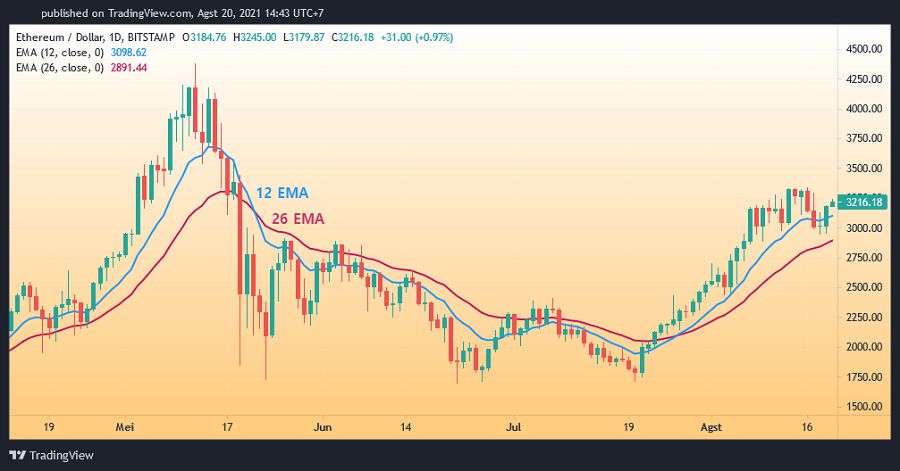
As EMA tends to catch the price changes quickly, traders mostly use EMA in smaller periods. The 12 and 26-day EMAs are the most common ones used for short-term trades, while for 50 and 200-days EMAs are more popular for long-term trades.
The chart below shows the use of 12 and 26-day EMAs in the Ethereum price chart.
3. Moving Average Convergence Divergence (MACD)
The last indicator that we're going to talk about is Moving Average Convergence Divergence (MACD), which is another popular indicator to use in crypto trading.
MACD is an indicator that is able to identify variations of momentums by comparing and analyzing two Exponential Moving Averages. It can assist traders in recognizing potential buy and sell opportunities around support and resistance areas.
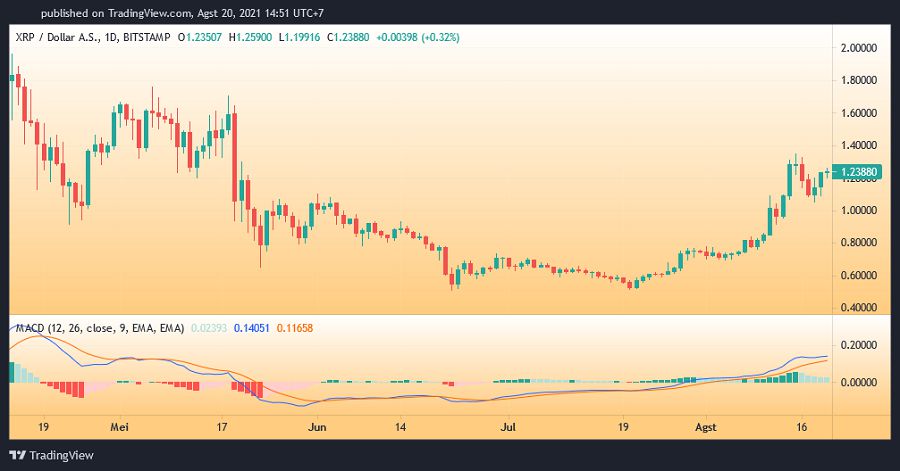
The MACD basically consists of four components, which are the MACD line, the signal line, the zero line, and the histogram. On the chart above, we're using a Ripple price chart with the 12 (short-term) and 26-period (long-term) EMA indicators as an example.
We can calculate the MACD line by deducting the 26-period EMA with the 12-period EMA. The signal line, by default, is a 9-period EMA; it is placed on top of the MACD line and can function as a trigger for buy and sell signals.
Moreover, there's also the zero line where the MACD line is at zero and the histogram that shows the distance of the MACD line from the signal line. If the MACD is above the signal line, the histogram will be above the MACD's baseline.
In contrast, if the MACD is below the signal line, the histogram will move under the MACD's baseline as well. The histogram can tell you when bullish or bearish momentum is strong.
Now to read the MACD indicator, you must be able to identify when a "convergence" or "divergence" happens. Convergence is when the two Moving Averages are moving in unison.
In contrast, divergence occurs when the MACD forms highs or lows that diverge from the corresponding highs or lows on the price. In other words, the indicator is moving in the opposite direction of the price.
Traders might prefer to apply an SMA strategy to place their buy and sell signals, but the measurement can be limited at times.
This is why MACD is a great addition as it can give an up-to-date description of what is happening in the crypto market, not only from the way the price moves but also from the momentum the market is in.
Final Words
To sum it up, cryptocurrency trading is not the same as gambling. It's true that you can end up losing money, but only if you don't have a proper strategy or use the correct tools.
Hence, applying technical indicators is a great way to reduce the risk of trading. It can help you filter the market noise, identify the price direction, and determine entry and exit signals.
While there are many ions of indicators, it's not wise to just them randomly and mindlessly combine them without knowing their compatibility with one another.
Sometimes, the indicators would use the same data set, which could cause conflicting signals that can confuse you. Consequently, it's best to pick indicators that are easy to understand and able to eliminate conflicting signals.
Last but not least, you must make sure that the indicators are compatible with your trading style.


 Bitcoin
 Ethereum
 Tether
 BNB
BNB Solana
 USDC
USDC XRP
XRP Dogecoin
 Toncoin
 Cardano