Dedicated FREE FOREX VPS
 Free FOREX Virtual Private Server
 MT4 Demo Contest, Get $500
 Sign Up for an Account, Claim 60% Deposit Bonus
 Free MT4/MT5 VPS 2024
 Send E-mail and Get Free Merchandise
 $1K Refer a Friend Bonus for Pepperstone Pro clients
 Maximize Your Earnings with 100% Deposit bonus
 Trade to Win, $5,000 Monthly Demo Contest
 Claim 30% + 15% Deposit Bonus from LiteFinance
Is it true that Gold and Yen tend to move in the same direction due to their characteristics as safe haven assets? Does it mean we can always trade XAU/USD against USD/JPY?
Gold is a popular trading tool in the precious metals asset class. Its appeal spans from intraday traders/speculators to those interested in actual bullion purchases. Some consider Gold to be the default money for humanity due to its reputation as a haven currency. Even millennials choose Gold as one of their main investments.
It's no surprise that Gold is attracting a lot of interest, from basic studies to more technical Gold trading tactics. This is partly because Gold may be traded in a variety of ways, including Spot Gold (XAU/USD), Gold Futures (GC), Gold ETFs (GLD), and even Gold (miner) equities like Barrick Gold Corp. (ABX) or Goldcorp Inc. (GG).
Many traders are unaware that Gold has a positive correlation with Yen. Let's look at the chart below, which compares Yen Futures to Gold Futures from June to December 2020. The peaks and troughs of Gold correlate to the peaks and troughs of Yen.
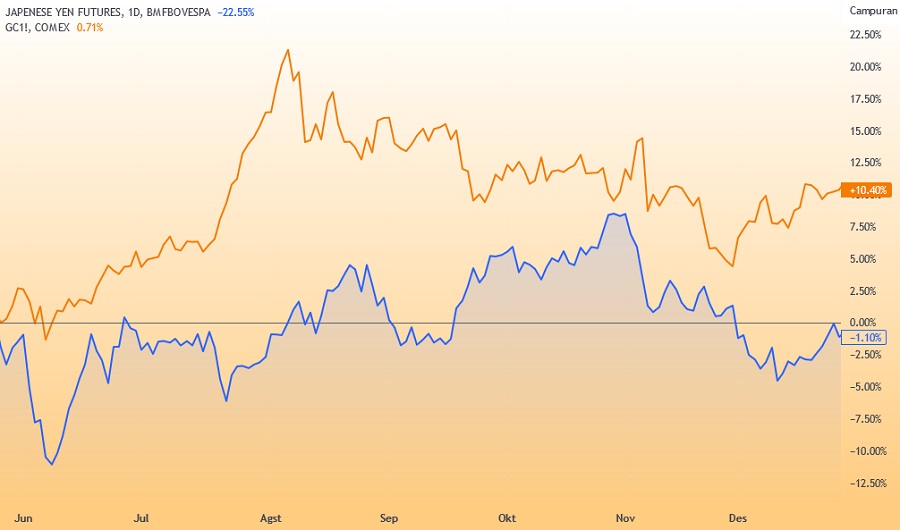
The graph also demonstrates that the connection is not perfect. In other words, the percentage-to-percentage change or point-to-pip basis between Gold and Yen is not precise. Nonetheless, there is a level of linkage that cannot be disregarded even though the strength of the association can also be shown to alter over time.
Why is Gold Correlated to Yen?
In actuality, there is no definite answer. Although the fact that Gold and yen are both considered safe havens lends credence to this claim.
However, this is only the tip of the iceberg. Market correlations ebb and flow. A more recent example that traders might recall is the short-term link between oil prices and stock prices in the first part of the year, which dissipated quickly. This brings up a key point: with any correlation, you cannot take it for granted. As a result, traders must regularly and at regular intervals monitor the link between Gold and Yen.
Long-term research by Goldmoney in 2017 repeatedly demonstrated that Gold is primarily influenced by three factors: real-interest rate expectations, longer-term energy costs, and central bank policies.
As a result, in the absence of large moves in longer-dated energy prices, such as the period since the end of 2015, and with the Fed focusing primarily on nominal rates rather than the previously deployed unconventional monetary policies, Gold prices are once again primarily driven by real interest rate expectations. Central bank policy is a major driver of real interest rates (setting rates and controlling money supply). However, some central bank policies, such as QE and government Gold sales, have an influence on Gold prices that goes beyond the impact on real interest rates.
Inflation-indexed bonds are the most convenient technique to gauge real interest rate expectations. Inflation-indexed bonds often pay a lower nominal yield than ordinary bonds but modify principal payments with an inflation index such as the CPI (consumer price index). Bond prices that are inflation-indexed include a wealth of information. They can, for example, be used to calculate the market's breakeven inflation predictions.
Simply put, if the nominal one-year bond yield is 3% and the comparable inflation-indexed bond yield is 1%, market inflation expectations are for 2%. However, the yield on an inflation-indexed bond is the predicted real-interest rate over that time horizon.
Both the United States and Japan issue bonds that have an inflation component. In the United States, they are known as Treasury Inflation-Protected Securities (TIPS), whereas in Japan, they are known as JGBs. While still overshadowed by the market for nominal government bonds, the US TIPS market is reasonably large and liquid. Financial data companies like Bloomberg not only give data on actual bond yields, but they also create a generic yield, which is a fake data series that demonstrates how the yield of a certain maturity fluctuates over time. The same has been true for the JPY in recent years.
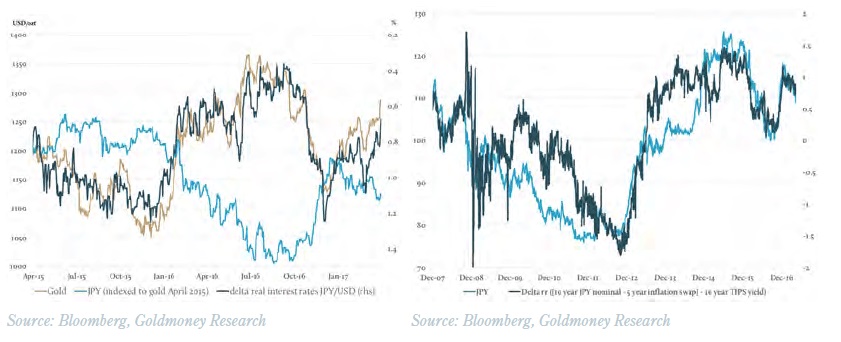
Left: Since the end of 2015, USD/JPY real interest rate differentials drove both Yen and Gold prices USD/ozt Gold and JPY (indexed); % delta real interest rate expectations.
Right: The JPY/USD exchange rate has broadly followed the differential real-interest rate expectations over long periods of JPY in USD; % delta real interest rate expectations.
The left picture depicts how closely the Japanese yen has moved in response to changes in real interest rate expectation differentials since early 2016. Coincidentally, that is also the time when Gold and the JPY moved into lockstep. Importantly, as seen in the right picture, Yen follows wide shifts in real interest rate expectation differentials over the long term. During this extended time, however, Gold prices were influenced not just by changes in real interest rate expectations, but also by substantial swings in longer-term energy costs and other central bank activity, such as numerous rounds of QEs. As a result, Gold did not trade in tandem with Yen.
See also: Gold Price Today
Japanese interest rates have been historically low in comparison to rates in the United States and most other Western economies. Since 1990, the average yield on a 10-year Japanese government bond has been 2.1 percent, compared to 4.7 percent in US bonds. However, the greater yield was accompanied by a higher inflation rate. It was 0.5 percent in Japan and 2.5 percent in the United States. As a result, the Japanese yen rose almost 30% against the USD over that time.
Changes in real interest-rate expectations should have an impact on carry trade investors since they represent the market's perspective on how lucrative their position will be in the future. As a result, when the real interest rate differential between two currencies changes, it should affect trading positions and consequently the demand and supply of the currencies involved.
In the absence of any other causes, this results in equivalent changes in exchange rates. However, the absence of any other driver is critical to this observation. JPY will only move following the real interest rate differential if no other forces are in action, and Gold will do the same. As long as the other factors influencing Gold prices remain consistent, Gold trades perfectly in line with actual interest-rate expectations. When longer-term energy costs change, as they did in 2014, Gold was influenced by several variables. In this situation, by a sharp drop in longer-term energy costs as well as changes in real interest-rate expectations.
Longer-term energy costs, on the other hand, have scarcely changed since the end of 2015, and there have been no changes in central bank policy other than interest rate rises. As a result, fluctuations in US real interest rates dominated Gold prices in USD. This has resulted in a strong link between Yen and Gold since the end of 2015.
How Can You Use the Gold and Yen Correlation?
It actually depends on how traders apply their trading strategy to both instruments. Say you use Moving Averages and divergence strategy, here's what it would look like:
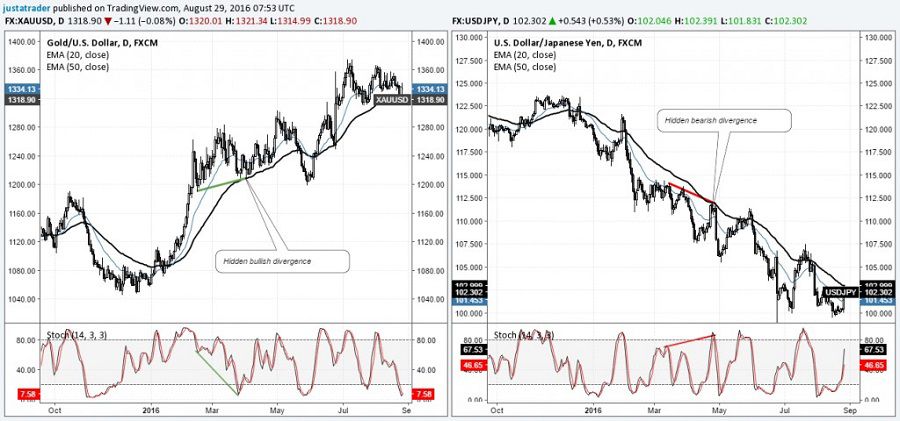 Charts courtesy of John Benjamin from Orbex
We can see how a hidden bullish divergence first appeared on Gold, which was later reflected on USDJPY's hidden bearish divergence. This signifies that Gold's rally is complemented by Yen's rally, thus concluding to USD/JPY heading lower.
We can also compare the candlestick patterns on both charts. Although quite subjective, patterns such as engulfing or inside bars are considered reliable across different assets' analyses.
To sum up, understanding the Gold and Yen correlation can be beneficial as it shows trading opportunities that might have been missed if we never compare the two instruments exclusively. As a reminder, we should remain cautious for correlations can change over time. Always pay attention to the fundamentals and watch out for major central banks' statements that could trigger short-term noises in the market.