Dedicated FREE FOREX VPS
 Free FOREX Virtual Private Server
 MT4 Demo Contest, Get $500
 Sign Up for an Account, Claim 60% Deposit Bonus
 Free MT4/MT5 VPS 2024
 Send E-mail and Get Free Merchandise
 $1K Refer a Friend Bonus for Pepperstone Pro clients
 Maximize Your Earnings with 100% Deposit bonus
 Trade to Win, $5,000 Monthly Demo Contest
 Claim 30% + 15% Deposit Bonus from LiteFinance
There are so many forex strategies out there to identify accurate trends and reversals. Let's dive into one that combines Heikin Ashi and EMA.
EMA stands for the Exponential Moving Average, which is an indicator used to pinpoint the most influential trend in the market while also indicating the support and resistance level needed for trades to be executed. On the other hand, Heikin Ashi is a price chart similar to candlesticks but is believed to be capable of displaying more accuracies in the price trend.
Heikin Ashi translates to "average bar" in Japanese. It works by averaging out the price movements in a proper candlestick chart because it shows trends and reversals better to make things clearer for the trader. It has a wide range of functions, like supporting short-term strategies whether it is for swing trading or day trading.
Additionally, Heikin Ashi is quite useful in any market including indices, forex, stocks, and commodities. Basically, it can truly enable traders to identify trends in order to stay in winning trades. However, like every forex market concept, an adequate understanding is being required for maximum advantage.
You'll find a better explanation about how Heikin Ashi and EMA collaborate in this article.
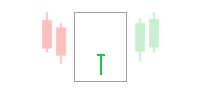
Heikin Ashi Candlestick
As mentioned earlier, Heikin Ashi is a variation of a candlestick chart that is calculated differently. Normal candlestick charts represent the opening and closing prices with the thick part of the candle (known as the real body) while the high and low prices are represented with upper and lower shadows. The patterns represent exact values of open, high, low, and close prices (OHLC) for the asset during a particular time frame without any form of data manipulation.
Heikin Ashi has similar features to a typical candlestick chart, except that the OHLC values are different for the underlying assets. Rather, its OHLC values are based on the average prices of both current and prior time frames, hence, making the charts smoother to read along and allowing traders to spot the prevailing trend.
Calculating the Heikin Ashi Values
To utilize Heikin Ashi values, there are four different calculations for the open, high, low, and close of a Heikin Ashi (HA) candle:
1. HA close is calculated by determining the average of the actual open, close, high, and low price of a specific period for an asset.
(High + Low + Open + Close) / 4
2. Calculating HA open is done by finding the average of prior Heikin Ashi candles open and close.
(Prior HA Open + Prior HA Close) / 2
3. HA candle high is identified as the highest of three price levels seen as:
- The prevailing high price
- The prevailing HA open price
- The prevailing HA close price
4. And the last part is HA low, which is the lowest of three price levels seen as:
- The prevailing low price
- The prevailing HA open price
- The prevailing HA close price
Using Heikin Ashi
Heikin Ashi is, without doubt, very helpful because it does take the correct price levels of the underlying assets before converting those prices using the Heikin Ashi formula. This is why the price values of Heikin Ashi usually differ from those on a candlestick chart. For a candlestick chart, the current price signifies the latest transaction while on a Heikin Ashi chart, the current price is the latest calculation of the HA close price. It's extremely common for these numbers to differ sometimes.
As mentioned above, Heikin Ashi is mostly used to fine-tune price data and identify trends and reversals. It should be pointed out that the prices seen on this chart cannot be used for trades, since the actual price of an asset can be different. Therefore, traders should have their eyes on both Heikin Ashi and the common candlestick chart.
Heikin Ashi EMA Strategy
Can Heikin Ashi be combined with Moving Average? Yes, Heikin Ashi can be used with Moving Average to produce more effective results that can impact the possibility of high winning trades.
Heikin Ashi notifies traders by alerting them whenever there is a change in the price direction. The change is achieved by changing color and direction, either from red to green or green to red. The red candles indicate selling pressure or bearish trend while the green candles signify buying pressure or bullish trend. Combining this with EMA would create a very reliable and accurate signal in predicting future changes in the market price.
With this strategy, once the price trades above the moving average, it indicates an uptrend, which means, as long as the trader keeps executing trades above EMA, it would be nothing but higher prices. Oppositely, if the price trades below moving average, that signifies a downtrend. As long as trader keeps trading below EMA, they can anticipate lower prices.
50-period and 20-period Exponential Moving Average lines are then added to the chart after which the trader waits for the price to trade above both EMAs. Once the bullish trend is confirmed, then trades can be executed.
When to Buy and Sell
For this strategy, there are some simple rules that traders can make use of to help them make profits during a trending market:
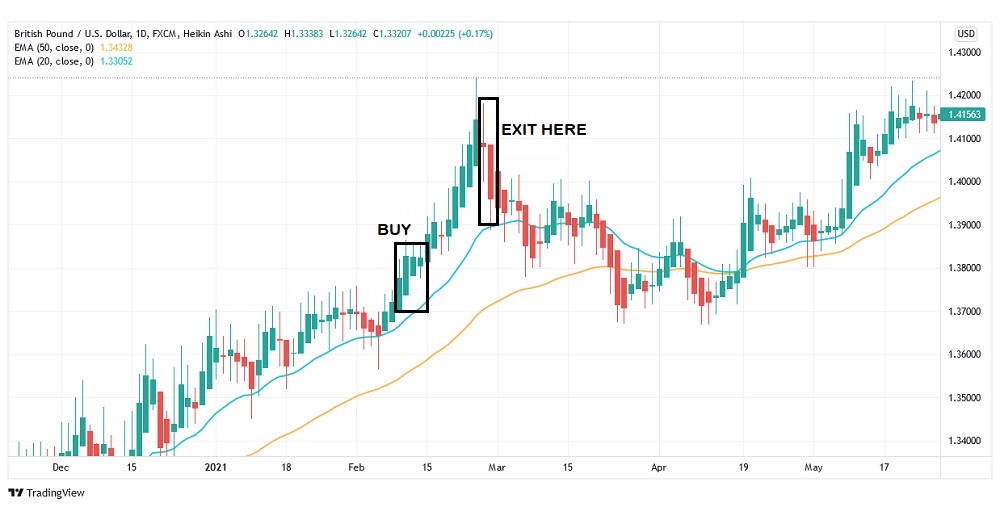
Buying should only be done when HA has changed from red to green within the last few candles and HA is positioned above the EMA lines. Then, exit the trade when HA changes color from green to red.
In a downtrend condition, here is the scenario:
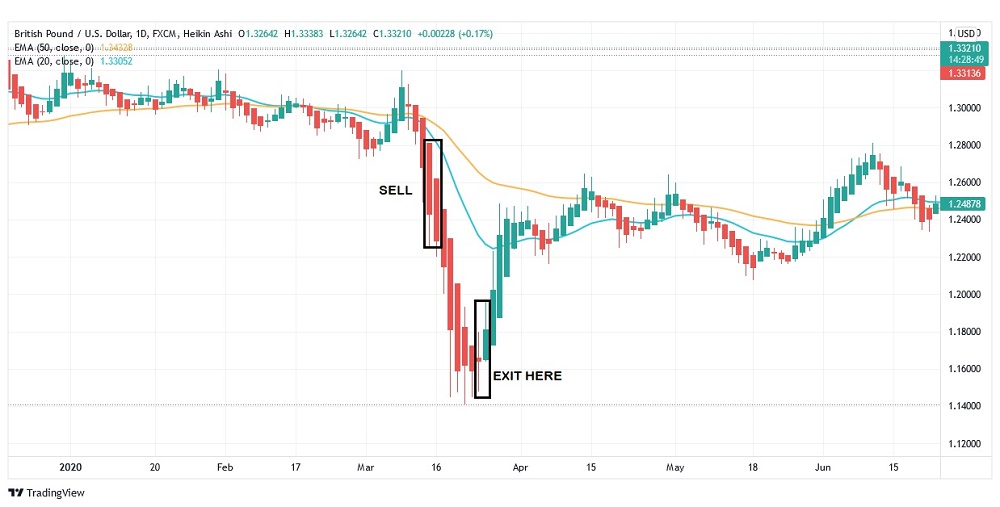
Sell only when HA has changed from green to red within the last few candles and the HA is below the EMAs. Once HA changes from red to green, you can exit the trade.
Combinations of strategies may offer better opportunities. We can combine indicators together or patterns together, or even better, indicators with candles so that we get an extra confirmation. The Heikin Ashi EMA strategy provides the best of technical indicator and a price action analysis. It can be one of the great tools to help trade with trend reversals.