Free FOREX Virtual Private Server
 Dedicated FREE FOREX VPS
 MT4 Demo Contest, Get $500
 Sign Up for an Account, Claim 60% Deposit Bonus
 Free MT4/MT5 VPS 2024
 Send E-mail and Get Free Merchandise
 $1K Refer a Friend Bonus for Pepperstone Pro clients
 Maximize Your Earnings with 100% Deposit bonus
 Trade to Win, $5,000 Monthly Demo Contest
 Claim 30% + 15% Deposit Bonus from LiteFinance
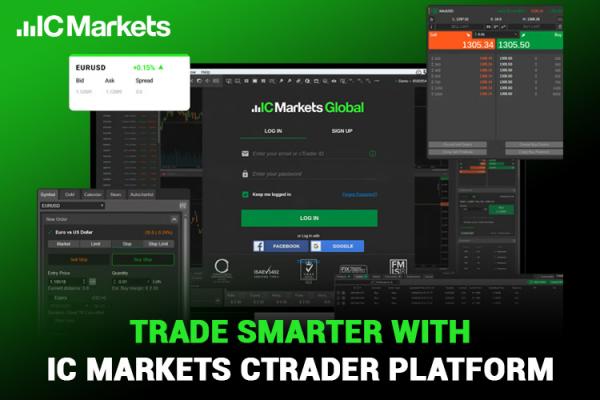
Enhance your trading performance with 20+ free MT4 advanced tools from IC Markets. Learn more to find out the details.
As a top-notch forex broker, IC Markets offers some great perks for forex traders. One of the cool deals they have is giving away advanced trading tools for free to IC Markets users.
For instance, you can get your hands on tools like the correction matrix, which neatly shows how different assets are connected in a single table. There's also a freehand drawing indicator that lets you doodle right on the charts.
In addition, there are more than 20 tools in their arsenal that can be super handy whether you're a beginner or a seasoned trader.
The best part? You can snag these tools for free by simply signing up for a demo account with IC Markets. The installation is a breeze, and they've got a comprehensive guide to show you the ropes.
If you're curious about how these tools work, let's dive into each one in detail.
IC Markets is an online forex broker operating under the company of International Capital Markets Pty Ltd. Traders under the Australian jurisdiction are provided with the trading service of IC Markets AU that is headquartered in Australia and licensed by the Australian Securities and Investments Commission (ASIC).
On the other hand, non-Australian traders who open an account in this broker are registered under IC Markets SEY that is based in Seychelles, and regulated under the Seychelles Financial Services Authority (SFSA). The dual operation is a result of the relatively new rules from ASIC that prohibit their regulated broker to offer trading services outside Australia.
Classified as an ECN broker, IC Markets provide clients with MetaTrader 4, MetaTrader 5, cTrader as platform trading options. This broker also follows market trends to include Cryptocurrencies as one of its products, enriching its already wide selection of trading assets that include Currencies, Indices, Metals, Energies, Softs, Stocks, as well as Bonds.
The minimum deposit in IC Markets is in the middle range compared to other ASIC-regulated brokers, as it reaches $200 for every client. Market analysis materials are also prepared regularly for trading insights on IC Markets's official website, proving their competence to serve their traders with important contents created by market experts that work specifically for them.
For payment methods, IC Markets allows funding and withdrawal via wire transfer, credit card, PayPal, Skrill, Neteller, FasaPay, UnionPay, as well as Bitcoin via BitPay. The more interesting aspect from this broker is its multi-base currencies that include USD, AUD, EUR, GBP, SGD, NZD, JPY, CHF, HKD, and CAD.
As the trading technology in IC Markets is highly equipped with co-located servers and extremely low latency (especially on cTrader), the broker is widely known for its capability in hosting traders with the special needs for high-frequency trading as well as scalping.
To sum up, IC Markets is a fitting destination for active traders looking for a well-regulated broker. IC Markets is also flexible in terms of base currency and payment methods, signaling their commitment to welcome traders beyond their home country. As of late 2019, IC Markets provided their website in 18 international languages including English, Korean, Indonesian, French, Spanish, Italian, Malay, German, and Chinese.
Download and Set Up MT4 Advance Trading Tools
As mentioned earlier, to get these advanced tools, you'll first need to create a demo account.
- Just head to the IC Markets official website's main page and click on "Try a free demo" at the top.
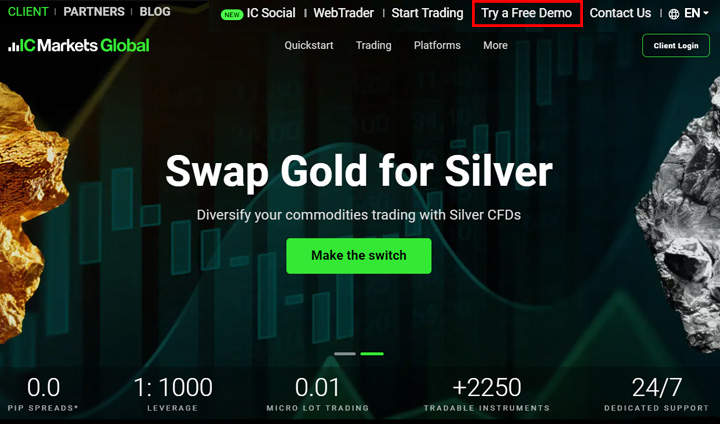
- This will take you to the demo account sign-up page. Fill out the form and follow the steps until you're done.
- Once your demo account is good to go, log in to your client area. You can then easily download these tools from the trading tools section under "advance trading." After that, simply download the installer to your IC Markets MT4.
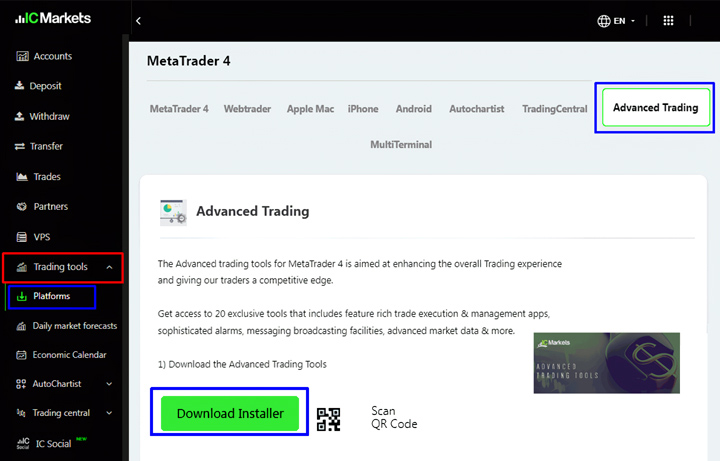
- Follow the installation steps through to the end. Once it's installed, you can use all these tools within your IC Markets MT4 platform.
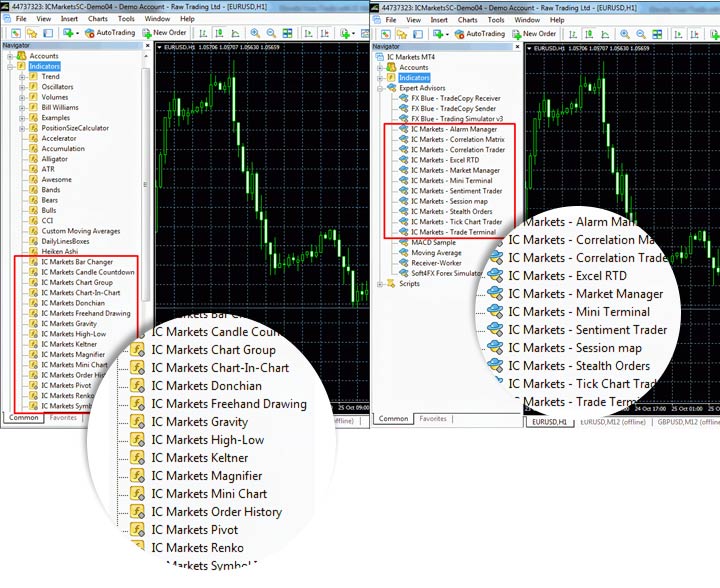
IC Markets MT4 Advance Tools
These tools come in two different forms: indicators and apps. There are 15 indicators and 11 apps in the form of expert advisors (EA).
Now, let's take a closer look at the detailed explanations of each of the indicators first.
Indicators
Here are the 15 indicators inside IC Markets MT4:
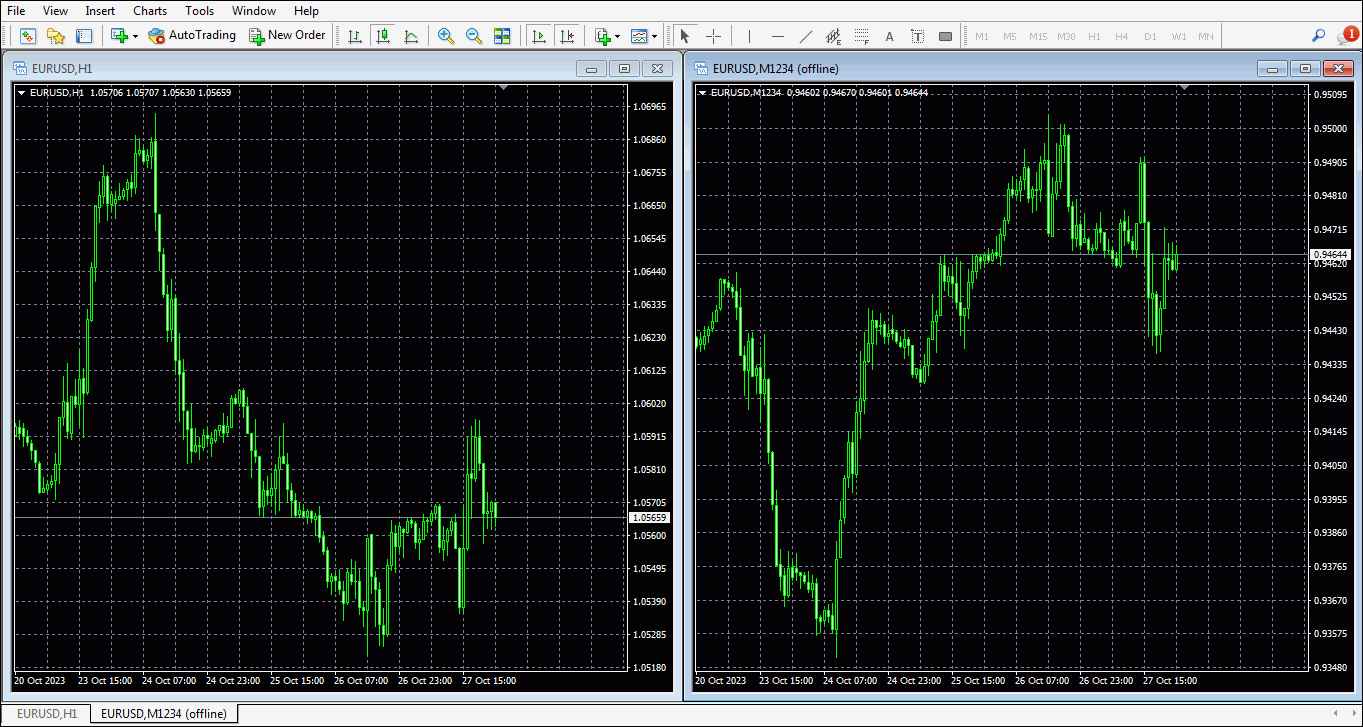
Bar Changer Indicator
The Bar Changer indicator creates an offline modified version of the selected chart. With the Bar Changer, you can do a few things to the bars:
- You can move the time of each bar, like shifting them back by 2 hours.
- You can flip the prices around or make them simpler, like changing 1.23456 to 12345.6.
- can pick only specific parts of the day, like just showing what happens between 09:00-16:59.
The daily time ranges option is mainly there to focus on the important times when trading index CFDs. These indexes are available 24 hours a day, but they are busiest during certain core market hours.
As an example, in the chart for Euro time frame (TF) H1 below, I'm using the IC Markets bar changer tool to make a new online chart that's flipped upside down (inverted).
Candle Countdown Indicator
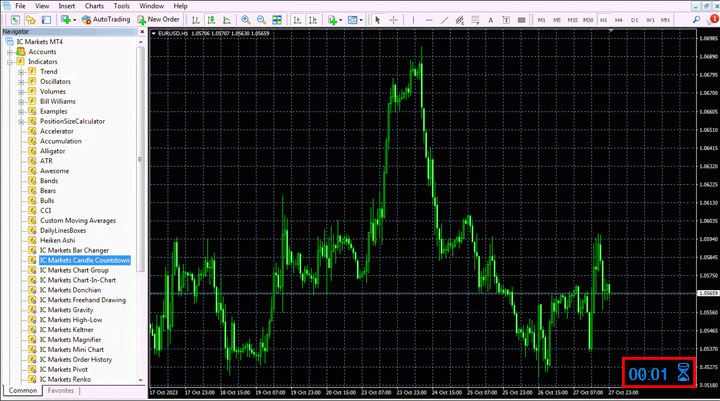
The Candle Countdown indicator on IC Markets MT4 tells you how much time is left in the current bar on your chart. Normally, it follows the chart's timeframe, but you can change that using the settings. You can even put more than one of these indicators to see different bar timeframes.
You can also set an alarm to give you a heads-up when a bar is almost finished.
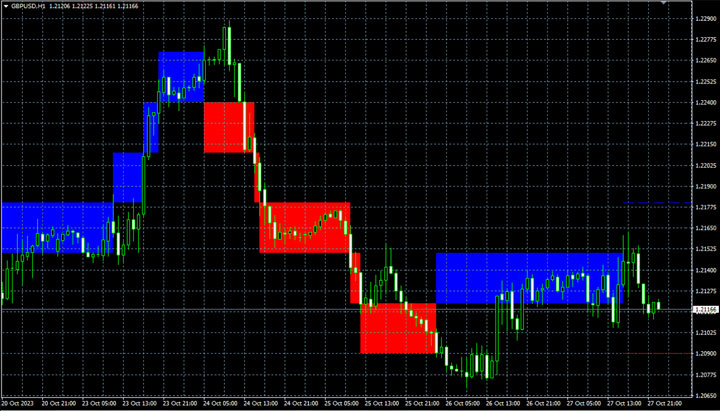
Chart Group Indicator
The Chart Group indicator brings a cool feature from professional trading platforms. It lets you connect different charts. So when you change the symbol on one chart, the same change happens on linked charts.
Here's an example: Imagine you have three open charts for EURUSD, set at M15, M30, and H1 timeframes. You use this indicator to link them together. Now, if you change one chart to a different symbol like GBPUSD, all the other charts also switch to GBPUSD automatically. This makes it super easy to switch between symbols on multiple charts without creating separate profiles for each symbol in MT4.
In the IC Markets MT4 chart example below, you'll see three sets of linked charts, marked in green, red, and blue. Changing the symbol on any chart will make its partner charts change too.
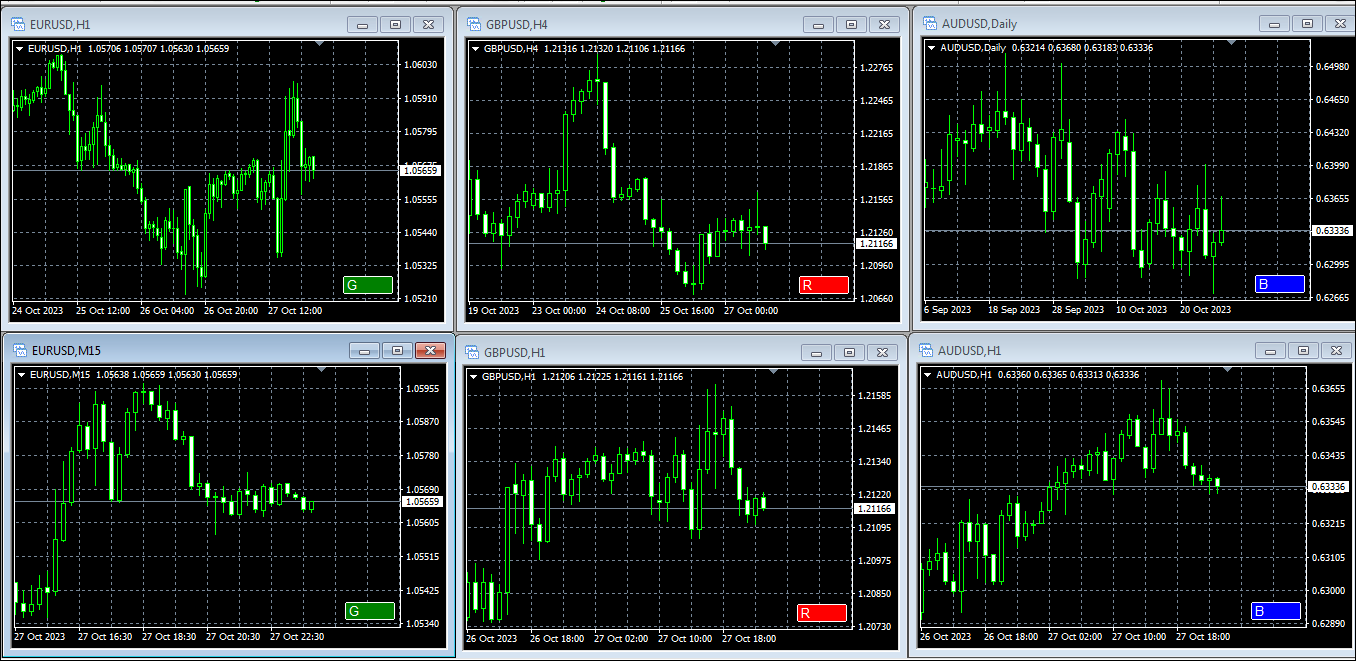
You can also use this indicator to sync timeframes instead of symbols. For instance, you have charts open for EURUSD, GBPUSD, and USDJPY. When you change the timeframe on one chart, the timeframes on the other two charts also change automatically.
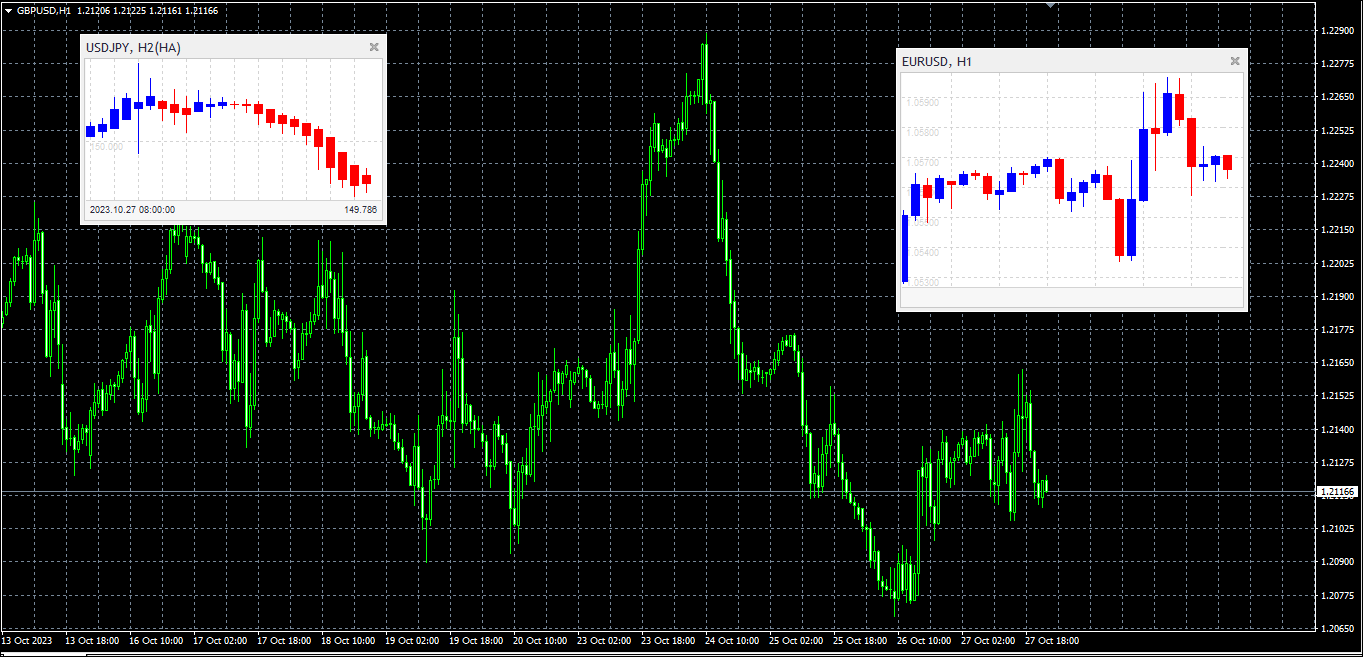
Chart - in - Chart Indicator
Think of the Chart-in-Chart indicator as a little window within your IC Markets MT4 main chart. It shows the price of another symbol. You can have multiple of these little windows to see more symbols all at the same time.
For example, if you're looking at the main GBPUSD chart, you can have smaller windows that show EURUSD and AUDUSD. You can also flip the prices around, like showing USDJPY as JPYUSD.
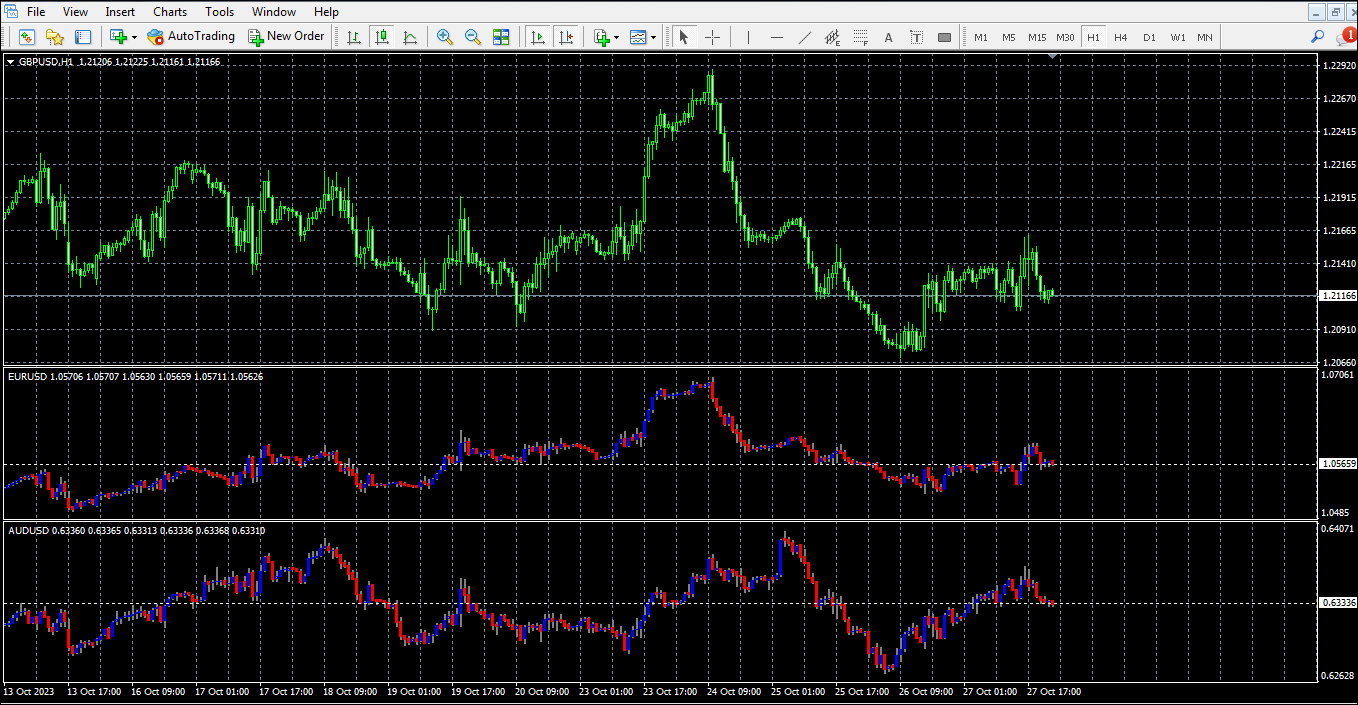
Even though these smaller windows can't do all the things a regular MT4 chart can, you can still include typical technical tools like moving averages and envelopes. You also have the option to show details about your active trades and upcoming orders.
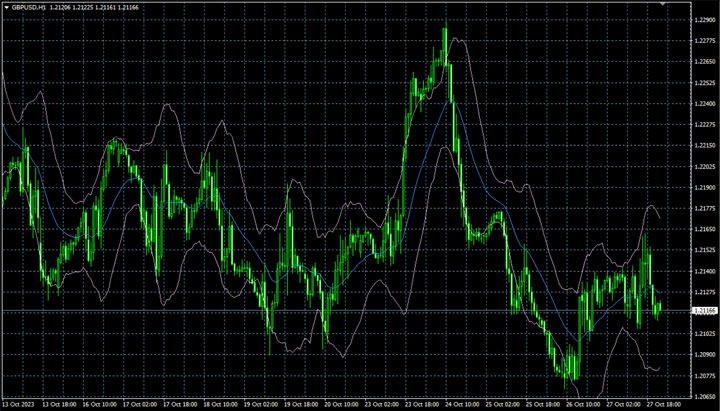
Donchian Indicator
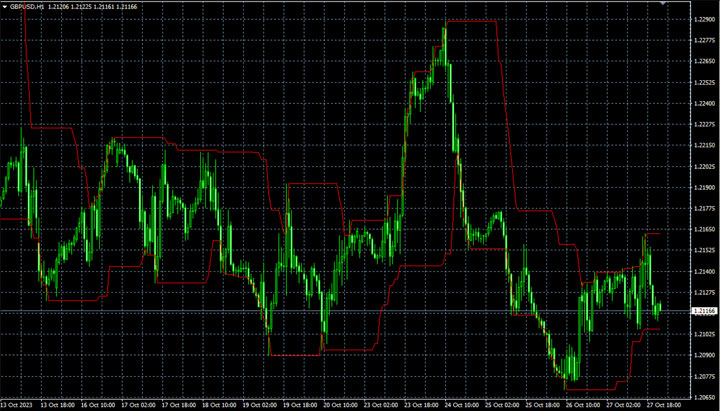
The Donchian indicator displays something called Donchian channels. It is basically two lines showing the highest and lowest points of the past N bars.
It's different from the regular Donchian calculation. This indicator gives you three other options:
- Show the average (mean) of the highs and lows,
- Show the middle point between the highs and lows
- Show the lowest high instead of the highest high.
You can also make the Donchian channel wider or narrower by a certain percentage, a specific price amount, or by using a multiple of ATR (Average True Range) or SD (Standard Deviation).
And if you want, you can set it to give you pop-up alerts when the current price crosses the high or low lines.
Freehand Drawing Indicator
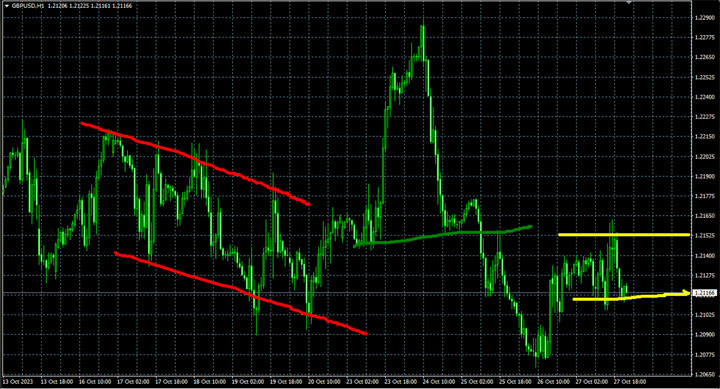
The Freehand Drawing indicator allows you to make drawings on IC Markets MT4 charts. This is handy for marking or emphasizing things on the chart, especially if you're doing a live webinar or sharing charts with others.
To draw, you just press a key and move the mouse. You can switch colors with keyboard shortcuts, and if you make a mistake while drawing, you can easily undo it.
Gravity Indicator
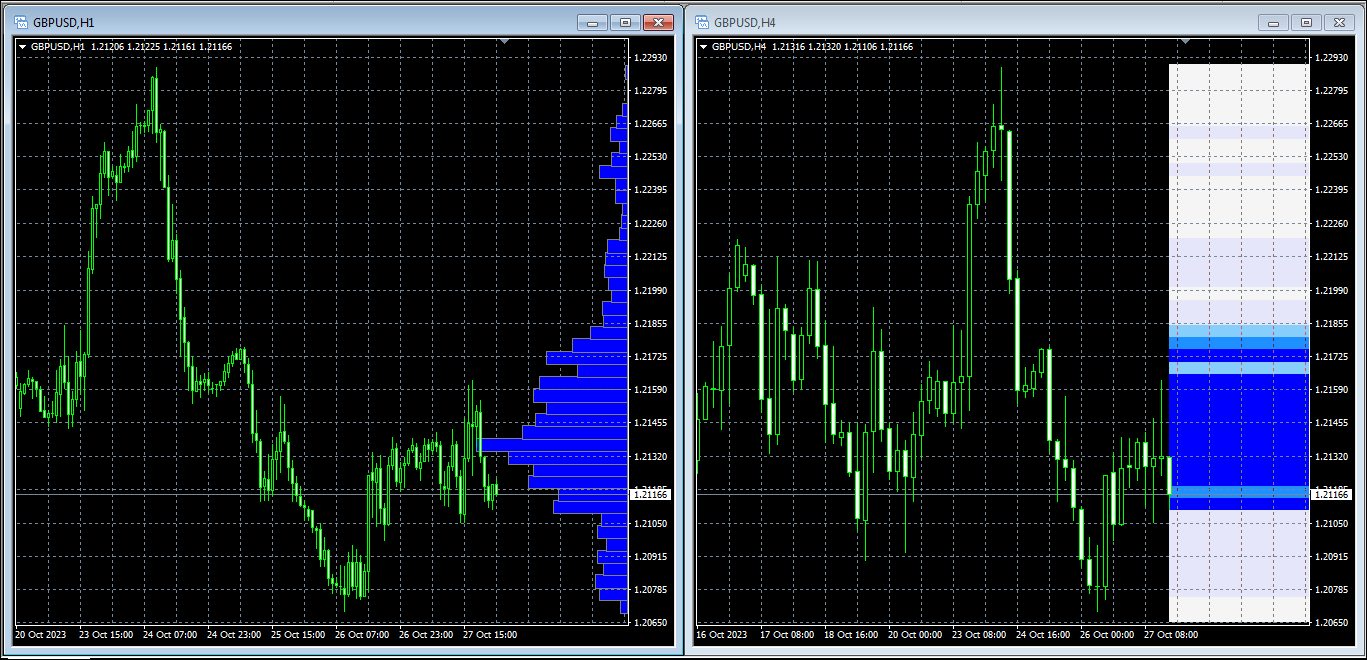
The Gravity indicator shows on the chart where prices might find support or resistance. It uses different colors to show how strong or weak these areas are based on past market activity.
You have two ways to use it: you can either let it consider all past data from the current time, or you can pick a starting point to see how it works without recent price moves.
High - Low Indicator
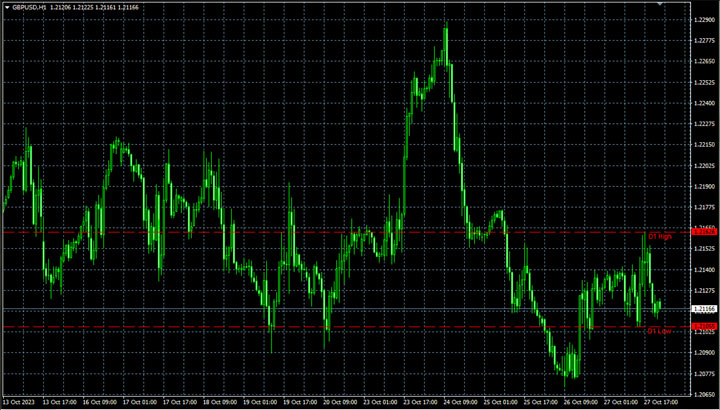
The High-Low indicator on IC Markets MT4 highlights the highest and lowest points on a chart, and you can do this for any timeframe or the number of bars you choose. You can even put multiple versions of the indicator on the same chart to see different levels, like the daily and 4-hour highs and lows on an hourly chart.
This indicator can also display the opening and closing prices, in addition to the high and low points. It can be set to focus on a specific time range within a day instead of the entire trading day.
You can also set it up to give you alerts when the current price goes beyond the historical high or low points.
Keltner Indicator
The Keltner indicator displays Keltner channels, which are kind of like Bollinger bands. But, instead of using standard deviation, the channel's width changes based on something called ATR.
You can set it up to alert you when the price goes over the upper or lower channel, which is often seen as a signal that the price might change direction.
Magnifier Indicator
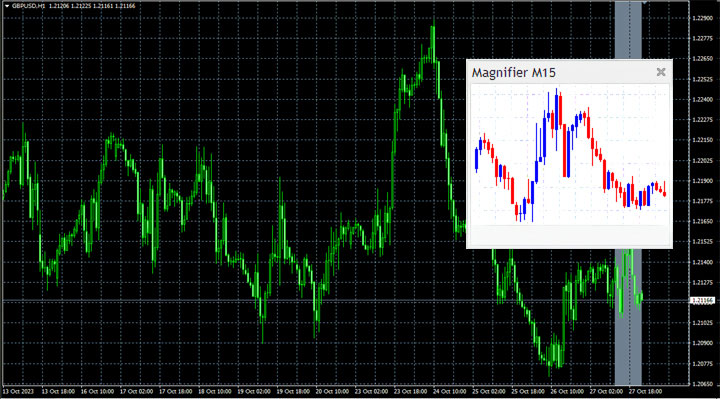
The Magnifier indicator makes a little window in your main IC Markets MT4 chart that you can move and make bigger or smaller. This window acts like a zoom-in tool and shows you a closer look at certain bars as if you're looking at M30 bars on an H1 chart.
You just grab and move the Magnifier around the chart to zoom in on different times in the past.
Mini Chart Indicator
The Mini Chart makes a small window inside your main IC Markets MT4 chart that you can move around and adjust. This little window lets you see what's happening with other currencies or timeframes without having to switch to different MT4 charts.
The Mini Chart offers many options such as:
- Different timeframes like M4 and H3, not just the usual M1 or H1
- Tick bars (e.g. bars formed from 10 ticks each) and second bars (like 20-second bars)
- Various chart types like Range, Renko, Kagi, and Point and figure charts
- Data transformations like Heikin Ashi and Three Line Break.
You can't use standard MT4 indicators on a Mini Chart. But it does have its own selection of popular indicators available, such as moving averages and Bollinger bands.
Order History Indicator
The Order puts your past trades on a chart, showing when you entered and exited a trade, along with the prices and times. It also uses colored bands to show when you are in or out of the market.
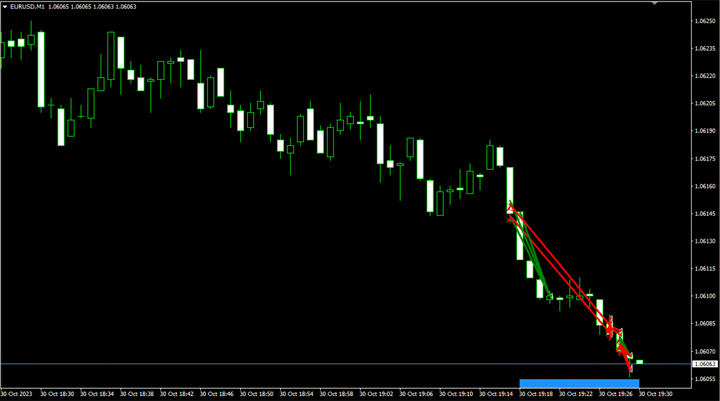
In this example, you can see individual trades for the EUR/USD symbol marked with entry and exit arrows connected by a line. The blue bands at the bottom of the chart show when you had a trade open for EUR/USD, and the grey bands show when you had a trade open for other symbols. When you change to different timeframes (like D1, H1, M1), it's like zooming in on your trading history.
If you hover your mouse over a past trade, you can see all the details about that trade. And if you hover your mouse over the blue or grey bands, you'll get the details about the trades that were open during that time.
Pivot Indicator
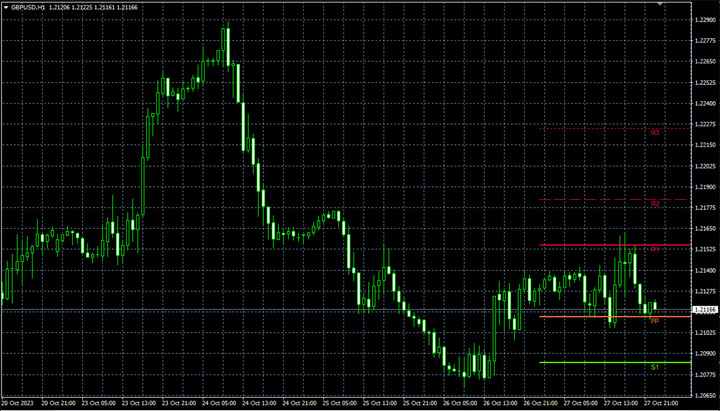
The Pivot indicator does a traditional pivot calculation by looking at past price movements. It figures out a central pivot price and then gives you three levels of support and three levels of resistance on each side (R1 to R3 and S1 to S3).
You can use this indicator on different timeframes. For instance, you can see H4 pivot levels on an M30 chart. Plus, you can set it up to give you alerts when the current price goes beyond a support or resistance level.
Renko Indicator
The Renko bar indicator adds Renko blocks to a regular MT4 chart that's based on time. These blocks can be drawn as a continuous line, or as separate pieces whenever a new Renko block finishes. Renko blocks can have different widths or gaps between them because they don't depend on time and have varying durations.
You can also use the indicator to create a separate offline MT4 chart that only shows the Renko blocks. This chart is more like a traditional Renko chart, not tied to time like a regular MT4 chart.
Symbol Info Indicator
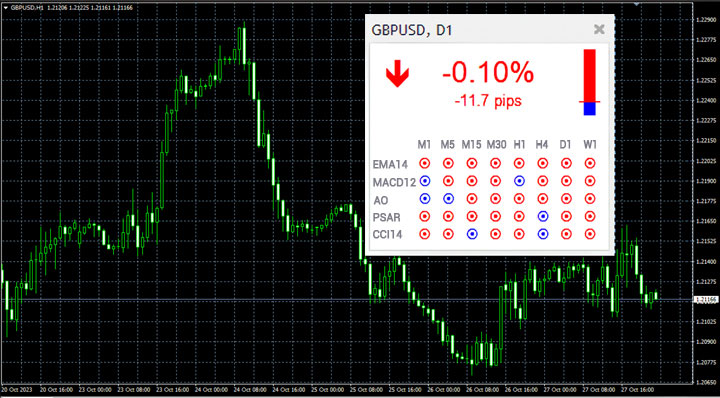
The Symbol Info indicator makes a little window inside your main IC Markets MT4 chart. The window shows important information about a symbol.
It tells you how much the price has changed and how far it is from the recent highest and lowest points. It can also show you some signals from various timeframes.
You can put multiple versions of this indicator on your chart to see info for different symbols or timeframes. You can also set each one up differently.
Apps (Expert Advisors/EA)
Here are the 11 apps inside IC Markets MT4:
Alarm Manager
The Alarm Manager does three main things:
- It tells you about things happening in your trading account and the market.
- It can take action automatically when these events occur.
- It can send updates to your followers through Twitter, email, or SMS.
Think of the Alarm Manager as a set of building blocks that you can use to create your personalized trading assistant. For instance, you can set it up to do any of the following:
- Warn you if your account's margin usage goes over 20%.
- Close your losing trades if your account's drawdown exceeds 10%.
- Share your trades on Twitter, email, or SMS.
- Place orders or close trades at a specific time, like "at 2 p.m." or "in 30 minutes."
- Notify you if you have open trades without stop-loss.
- Automatically trade based on technical indicators like RSI or moving averages.
- Alert your followers on Twitter when an instrument hits a new 30-day high.
- Celebrate your success with a message after 3 consecutive winning trades.
- Remind you to stop trading after 4 consecutive losing trades, if your balance drops by more than 3%, or if your win/loss percentage falls below 30%.
- Notify you 10 minutes before important economic events.
- Open a new trade when RSI is high on three different timeframes.
- Place an order when RSI goes above 70 or there's a MACD signal line crossover.
Correlation Matrix
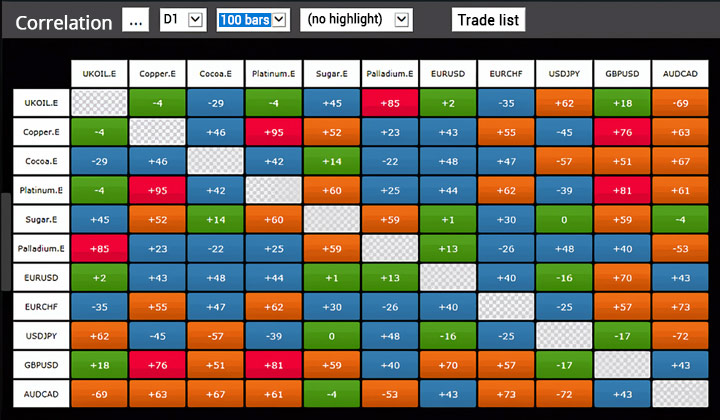
The Correlation Matrix on IC Markets is like a tool that tells you how much two symbols are similar in price movement, based on a certain period and number of bars, like the last 100 H1 bars.
This similarity is measured on a scale from -100 to +100:
- +100 means that the symbols move in the same way, which is called "positive correlation."
- -100 means they move in opposite directions, like one goes up when the other goes down, known as "negative correlation."
- 0 means the symbols move independently, with no clear connection.
Correlation is important because it affects your trading risk. For example, if you see two symbols with a strong negative correlation (around -95), it means they move in opposite directions. So, if you bet on one symbol going up and the other going down, it's almost like having just one trade because they kind of balance each other out.
It's usually a good idea to avoid having highly correlated trades. Otherwise, you might end up essentially trading the same thing twice or having trades that cancel each other out. The Correlation Matrix helps you figure out which symbols have strong or weak correlations, so you can make smarter trading decisions.
Correlation Trader
Think of the Correlation Trader as a smaller version of the Correlation Matrix. Instead of showing many symbols, it focuses on just two symbols displayed together.
Its purpose remains the same. First, it helps you find symbols that have strong or weak correlations. Second, it allows you to trade when you notice changes in these correlations.
Remember to avoid having highly correlated trades. Because you might end up either trading the same thing twice or having trades that cancel each other out.
Excel RTD
The Excel RTD app does a couple of things:
- It helps you put real-time data into Excel using just Excel's RTD function. You don't need to deal with macros, programming, or XLL add-ins.
- You can also send simple trading commands from VBA code in Excel.
You can use multiple copies of the Excel RTD app for various accounts and then bring all that account data together in one spreadsheet. The app comes with an example spreadsheet where you can input up to 5 account numbers. It then automatically shows you a dashboard with information about equity, balance, symbol prices, and a list of open positions, all in one place.
Market Manager
The Market Manager has four main features:
- It displays a "watch list" showing symbol prices and open positions. You can use it to close existing positions or open new ones.
- It provides essential information about your account, like equity, balance, and margin usage.
- It lists all your open tickets, including positions and pending orders. You can open each ticket in a separate window and make changes or close the position or order.
- It gives you a short summary of recent price movements for a symbol.
Mini Terminal
The IC Markets Mini Terminal is like a window where you can place orders to buy and sell with big buttons.
You can decide how much you want to trade and set things like stop-loss, take-profit, or trailing-stop by using the boxes above the buy and sell buttons. If you hold down the Ctrl key and click on these boxes, it opens up calculators.
For example, let's say you're trading 0.25 lots, and you want a stop-loss that represents $100. You can Ctrl+click on the S/L box and ask the calculator to figure out how many pips make up a $100 risk.
Sentiment Trader
The IC Markets Sentiment Trader shows you the percentage of traders who either bought or sold a symbol. This information doesn't come from analyzing prices; it's based on real-money accounts shared on www.fxblue.com.
For instance:
- 5845 real-money accounts on www.fxblue.com have bought EURUSD.
- 2378 accounts have sold EURUSD.
- So, the Sentiment Trader says the sentiment for EURUSD is 71% bullish (long).
The list of symbols available is decided by how many people trade them. For symbols like CADJPY, sentiment data isn't available because there aren't enough traders with open positions to calculate a meaningful percentage.
When a trader has multiple open orders for the same symbol, the sentiment calculation combines them into a single net figure. For example, if a trader has one order to buy 1.5 lots and another to sell 0.7 lots of the same thing, they are treated as bullish.
The sentiment percentage doesn't consider the size of the trades. Whether a trader is long 0.1 lots or 50 lots, they have the same impact on the figures because some users on www.fxblue.com have very large accounts and trade sizes.
Session Map
The Session Map is a tool that tells you what time it is in your local area during important trading hours. It's the time where the professional traders are active in Sydney, Tokyo, London, and New York.
It also marks upcoming news events and shares info about your trading profits and equity. It also gives you an idea of how prices have moved during each of these trading sessions.
Just remember that the time it shows is based on your computer's clock, so it's only as accurate as your computer's time.
Stealth Orders
IC Markets Stealth Orders are a way to keep your buying and selling levels secret in the market. Instead of setting up orders that others can see, the app instantly buys or sells at the current market price when your chosen level is reached.
This means there's no visible order in the market for others to spot. You can also use it to set up hidden stop-loss or take-profit levels that automatically close your trade when the price hits them.
The app can do four main things:
- Stealth entries: These are like limit and stop orders, and you can create groups of orders where one fills and the rest cancel.
- Stealth exits: Similar to setting take-profit or stop-loss for a single trade. You can specify exit points in terms of cash, like "take-profit at +$50," instead of specific prices.
- Symbol exits: These close all positions and orders for a specific symbol when a price is hit or when their combined profit reaches a certain level. You can also apply filters like "only close long EUR/USD orders with 'Breakout' in their comment."
- Account exits: These close all positions and orders for your entire account when a specific level is reached.
However, there are two downsides to using stealth entries and exits when compared to regular pending orders:
- You might experience more slippage with stealth orders. Although sometimes it can work in your favor.
- Stealth orders only work when the app is open and connected to your broker. In contrast, a typical pending order, stop-loss, or take-profit order will still work even if your trading software isn't running. Or maybe your internet connection is lost.
Tick Chart Trader
The Tick Chart Trader on IC Markets is a tool that displays tick charts in different styles and lets you trade quickly using your keyboard or mouse. These tick charts are created from the moment you start using the app, and it doesn't offer access to historical tick data.
The app offers five types of charts:
- Tick charts
- Tick speed charts
- Timed charts
- Tick candle charts
- "Versus" charts
It also provides a super-fast way to enter and exit positions based on a first-in, first-out (FIFO) method using either your keyboard or mouse.
Trade Terminal
The Trade Terminal is divided into three parts:
- Market Watch
- Account Summary
- Order List
You can make the account summary and order list smaller by clicking on the double arrows in their title bars. This gives more room to the market watch.
The Trade Terminal displays all the activity in your account, not just the orders made with the Trade Terminal itself. For instance, if you're using an automated system or placing manual trades within MT4, all of that will be shown in the Trade Terminal's account summary and order list.
Final Thoughts
In conclusion, IC Markets MT4's advanced tools are very useful for traders. These tools enhance your technical analysis capabilities and provide efficient execution. It also features risk management.
Even though these tools are meant for more experienced traders, newcomers can also give them a try. For example, there are indicators like the candle countdown, freehand drawing indicator, and sentiment trader.
If you'd like to use them, start with a demo account for practice. Once you're confident, you can use them in a real trading account.