Fibonacci Calculator - A Powerful Technical Tool
The Fibonacci calculator will show you the retracement and extension levels according to the popular Fibonacci theory used in forex trading.
| Uptrend |
|
*) The highest price point according to your observations
(example: 1.35000)
*) The lowest price point according to your observations
(example: 1.31000) |
| Retracements | |
| 0% (b) | |
| 23.6% | |
| 38.2% | |
| 50% | |
| 61.8% | |
| 76.4% | |
| 100% (a) | |
| 138.2% | |
| Extensions | |
| 261.8% | |
| 200% | |
| 161.8% | |
| 138.2% | |
| 100% | |
| 61.8% | |
| 50% | |
| 38.2% | |
| 23.6% | |
| Downtrend |
|
*) The highest price point according to your observations
(example: 1.35000)
*) The lowest price point according to your observations
(example: 1.31000) |
| Retracements | |
| 138.2% | |
| 100% (a) | |
| 76.4% | |
| 61.8% | |
| 50% | |
| 38.2% | |
| 23.6% | |
| 0% (b) | |
| Extensions | |
| 23.6% | |
| 38.2% | |
| 50% | |
| 61.8% | |
| 100% | |
| 138.2% | |
| 161.8% | |
| 200% | |
| 261.8% | |
How to define Fibonacci for forex trading?
Generally, traders use Fibonacci patterns to find the retracement of the current trend. Price movements in the forex market dynamically tend to "bounce" (retrace) from the Fibonacci lines, where these lines represent certain price levels that market participants always monitor before they trade. The stages are divided into the following series of numbers:
- Retracements: 0, 0.23, 0.38, 0.5, 0.61, 0.78
- Extensions: 1.27 and 1.61
If the trend is relatively strong because it is driven by certain high impact events, the price will dash through the retracement limit and is likely to experience a reversal after hitting the limit on the extension line.

Continue Reading at 5 Powerful Strategies of Fibonacci Patterns
How to apply Fibonacci Retracement on a trending chart?
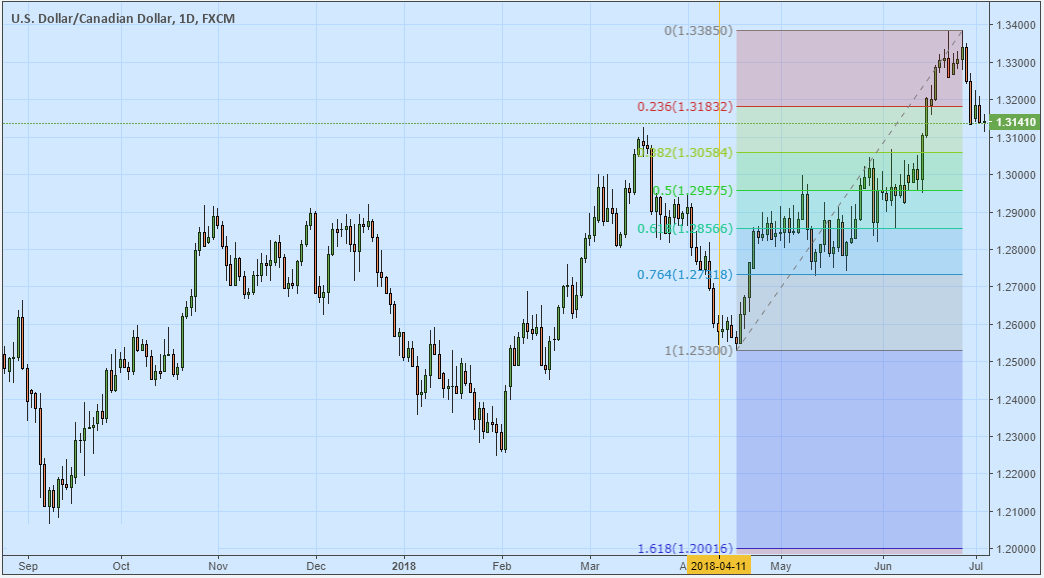
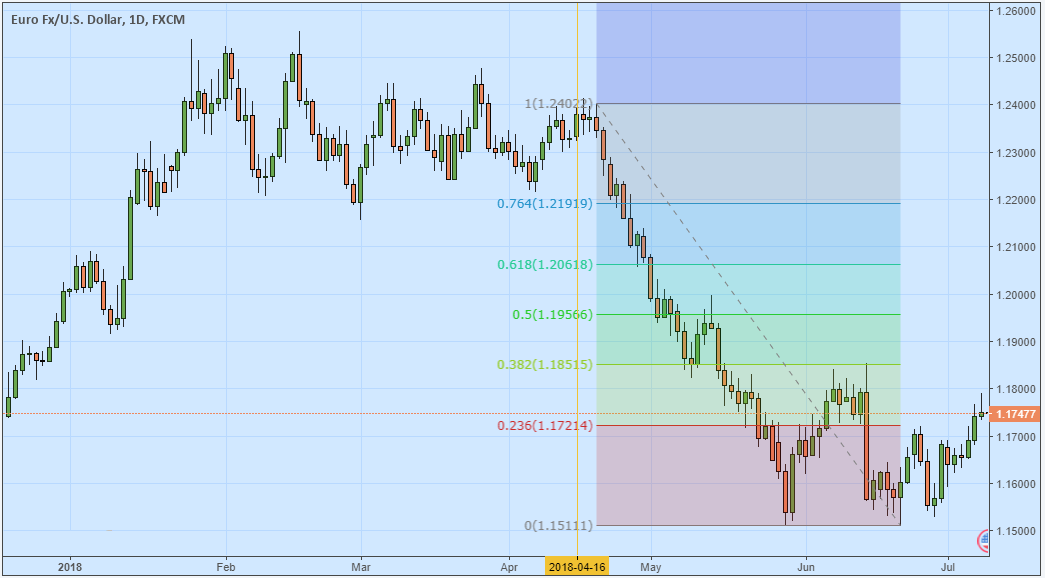
The retracement direction is from top to bottom in a downtrend and from bottom to top in an uptrend. Here are the results:
USD/CAD Daily chart with Fibonacci Retracement during an uptrend
EUR/USD Daily chart with Fibonacci Retracement during a downtrend
Continue Reading at Learn How to Use Fibonacci in Financial Trading
How to exit a trade with Fibonacci retracement?
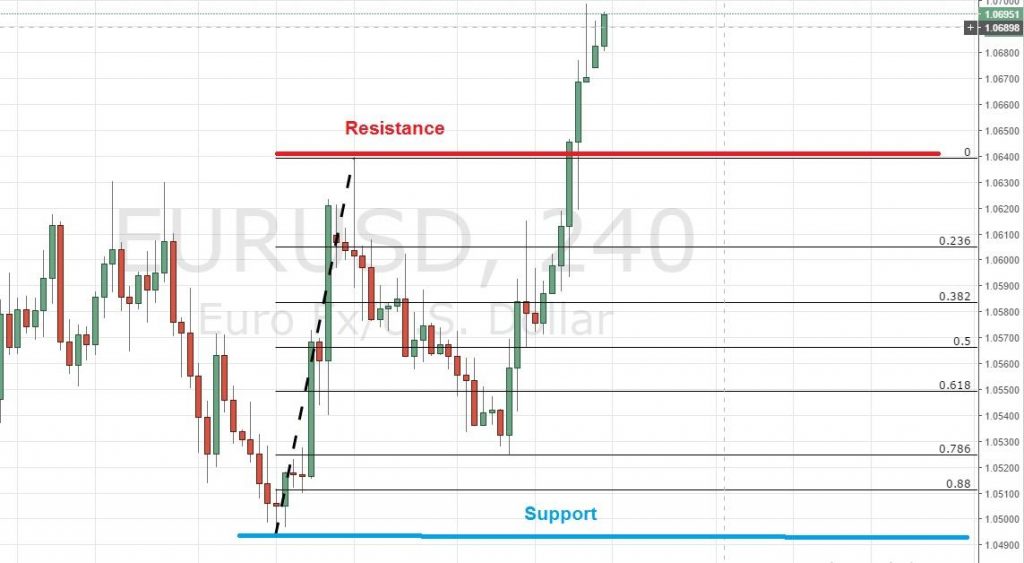
You see, the price retraced on particular Fibonacci turning points, which is at 0.786. What it does mean is, when the price "weakened" to 78.6% of the previous trend, the market slung back up again.
Profit-taking is best as you enter a trade when the price is moving to certain Fibonacci "threshold". Try waiting for the price action to hit either 0.618 or 0.768 Fibonacci points and then close the position once it's spotted near resistance or support limit.
Continue Reading at 3 Best Methods to Improve Forex Profit Taking
How to use Fibonacci sequence as the basis of AB = CD pattern?
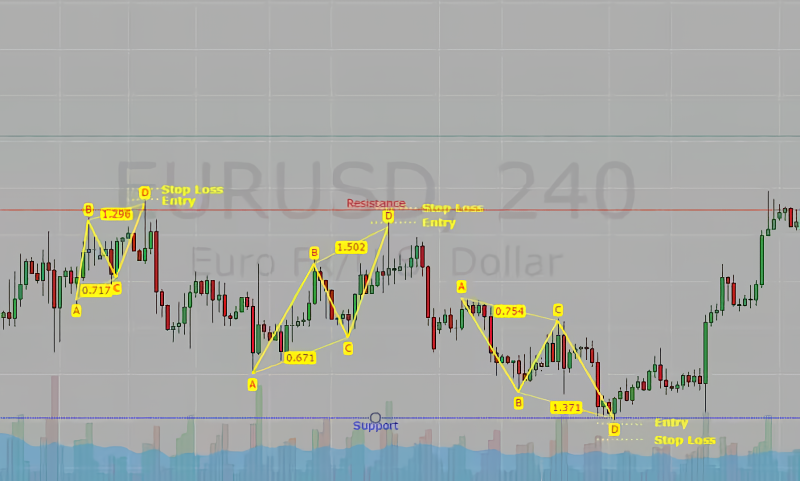
At first glance, the AB = CD pattern looks like a zigzag pattern. But keep in mind that the lines are not just drawn without certain conditions.
- The leg of the AB line is drawn from the lowest price (low) to the nearest high.
- Next, for the retracement of the AB leg, the BC line should be at the 0.38 to 0.78 retracement level (ideally at 0.68) from the AB line.
- The leg of the CD line is drawn from the low of the BC line towards the next high with a limit of 1.27 to 1.68 extension of the BC line.
Continue Reading at 5 Powerful Strategies of Fibonacci Patterns
Fibonacci Articles
-
Five Mistakes In Using Fibonacci Retracement
-
How to Deposit and Withdraw in FIBO Group
-
How to Open Account in FIBO Group
-
5 Powerful Strategies of Fibonacci Patterns
-
How to Verify Account in FIBO Group
-
Learn How to Use Fibonacci in Financial Trading
-
FIBO Group App Review: Trading Made Easy for Beginners
-
Practical Fibonacci Retracement For Forex Trading
- More
