Real-time Candlestick Update - Get the Latest Pattern
The data below is presented to make it easier for you to get candle updates in major pairs from various time frames. Thus, you don't need to manually interpret candlestick patterns on the chart to get trading signals.
| Time Frame | Indication | Candle Time |
|
NZD-USD
M30
|
|
Now |
|
|
||
|
A one-candle pattern that closes near or at the highest price (High), thus indicating a weakening of the downtrend momentum. The longer the lower axis and the smaller the body candle, the higher the accuracy of the bullish reversal signal. |
||
|
XAU-USD
M30
|
|
Now |
|
|
||
|
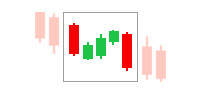
A multi-candle pattern (more than 3 candles). The first candle is long bearish and is followed by several short bullish candles that signal a correction. A bearish continuation is confirmed when a long bearish candle is formed again which touches a new low and closes the Falling Three Methods pattern. |
||
|
USD-JPY
Weekly
|
|
Now |
|
|
||
|
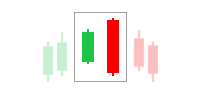
This pattern consists of two candlesticks. The first candle is bearish and engulfs the second bullish candle. This pattern indicates that the downtrend is starting to lose momentum. Although it can increase signal accuracy, the axes of the second candlestick do not have to be in the range of the first candlestick. |
||
|
XAU-USD
M15
|
|
Now |
|
|
||
|
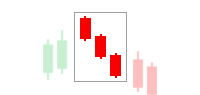
A three-candle pattern, all of them are long bearish candles. The closing price of the second candle is lower than the first candle, as well as the closing price of the third candle compared to the second candle. This pattern indicates a bearish momentum that can still bring prices down. |
||
|
USD-CHF
H1
|
|
May 6 2024 11:00:00 |
|
|
||
|
A one-candle pattern that occurs at the top of an uptrend. The open creates a gap up from the previous candle, then closes near the low. A confirmation signal breach is obtained from the next candle that opens with a price below the Shooting Star body candle. |
||
|
AUD-USD
H5
|
|
May 6 2024 05:00:00 |
|
|
||
|
A one-candle pattern that occurs at the top of an uptrend. The open creates a gap up from the previous candle, then closes near the low. A confirmation signal breach is obtained from the next candle that opens with a price below the Shooting Star body candle. |
||
|
USD-CHF
H1
|
|
May 6 2024 10:00:00 |
|
|
||
|
A one-candle pattern opened lower than the previous candle. The feature of the Inverted Hammer is that it has a small body and a long upper axis. The longer the upper axis and the smaller the body, the more significant the Inverted Hammer bullish signal. |
||
|
XAU-USD
H1
|
|
May 6 2024 10:00:00 |
|
|
||
|
Engulfing Bearish pattern consists of two candlesticks. The first candlestick is bullish and 'eaten' by the second candlestick which is bearish. This pattern indicates a weakening uptrend momentum and strengthening bearish sentiment in the market. |
||
|
NZD-USD
M15
|
|
May 6 2024 12:15:00 |
|
|
||
|
A one-candle pattern that closes near or at the highest price (High), thus indicating a weakening of the downtrend momentum. The longer the lower axis and the smaller the body candle, the higher the accuracy of the bullish reversal signal. |
||
|
NZD-USD
M30
|
|
May 6 2024 11:30:00 |
|
|
||
|
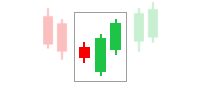
A three-candle pattern, the first candle is long bearish followed by the second candle that forms a gap down and has a small body. The third candle is a bullish candle confirming a reversal. The bigger of the third body candle reflects the accuracy of the bullish reversal signal. |
||
| Completed Patterns | ||
|
|
||
|
A one-candle pattern that closes near or at the highest price (High), thus indicating a weakening of the downtrend momentum. The longer the lower axis and the smaller the body candle, the higher the accuracy of the bullish reversal signal. |
||
|
|
||
|
A three-candle pattern, the first 2 candles form a Bullish Engulfing formation, while the third candle pattern is a bullish candle that confirms a bullish reversal. |
||
|
|
||
|
A three-candle pattern, all of them are long bearish candles. The closing price of the second candle is lower than the first candle, as well as the closing price of the third candle compared to the second candle. This pattern indicates a bearish momentum that can still bring prices down. |
||
|
|
||
|
A two-candle pattern, the first candle is bearish and "engulfed" by the second bullish candle. This candle pattern indicates a weakening of the downtrend momentum which is taken over by bullish sentiment. |
||
|
|
||
|
A one-candle pattern that closes near or at the highest price (High), thus indicating a weakening of the downtrend momentum. The longer the lower axis and the smaller the body candle, the higher the accuracy of the bullish reversal signal. |
||
|
|
||
|
A one-candle pattern that occurs at the top of an uptrend. The open creates a gap up from the previous candle, then closes near the low. A confirmation signal breach is obtained from the next candle that opens with a price below the Shooting Star body candle. |
||
|
|
||
|
A one-candle pattern opened lower than the previous candle. The feature of the Inverted Hammer is that it has a small body and a long upper axis. The longer the upper axis and the smaller the body, the more significant the Inverted Hammer bullish signal. |
||
|
|
||
|
A one-candle pattern opened lower than the previous candle. The feature of the Inverted Hammer is that it has a small body and a long upper axis. The longer the upper axis and the smaller the body, the more significant the Inverted Hammer bullish signal. |
||
|
|
||
|
A one-candle pattern that closes near or at the highest price (High), thus indicating a weakening of the downtrend momentum. The longer the lower axis and the smaller the body candle, the higher the accuracy of the bullish reversal signal. |
||


What Doji candlesticks we can use in the H4 strategy?
There are at least three H4 trading strategies with the Doji candlestick:
- Morning Doji Star: a bullish reversal pattern consisting of one bearish candle (1st), followed by a Doji candle (2nd), and one bullish candle (3rd). The body of the Doji should be below both the first and second candles.
- Evening Doji Star: a bearish reversal pattern consisting of one bullish candle (1st), followed by a doji candle (2nd), and one bearish candle (3rd). The body of the Doji should be above both the first and second candles.
- Doji Sandwich: a trend continuation pattern that can appear during both a downtrend and an uptrend. During a market downtrend, Doji Sandwich will show up as three candles in which the first bearish candle (1st) is followed by a Doji candle (2nd) and a second bearish candle (3rd). The condition in an uptrend is basically the opposite.
Continue Reading at H4 Trading Strategy with Doji Candlestick
What is the use of Heikin Ashi candlestick?
Developed by Munehisa Homma in the 1700s, The Heikin Ashi, also spelled Heiken Ashi, is a type of candlestick pattern that filters out market noises. The Heikin-Ashi candlesticks chart provides a better look at trend directions, making it easier for traders to read and analyze the market.
Continue Reading at Heikin-Ashi Strategy: An Easy Way to Follow the Trend
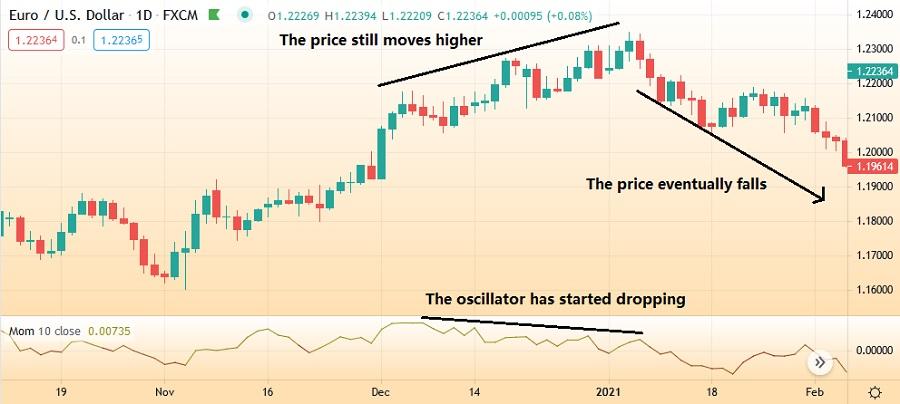
How to combine candlestick with oscillator indicator?
If you spot an oscillator divergence, then the candlestick reversal patterns are more likely to be more powerful and result in better trades.
The following chart shows divergence in an oscillator. We can see that while the trend in the chart is going upward, the oscillator shows quite the opposite. This indicates weakness in the trend, which you can confirm by looking at the price action that could barely make new highs before falling again. Eventually, the price drops down significantly. Once you are able to find the divergence on the chart, the next step would be to define the turning point by finding a reversal candlestick pattern.
Continue Reading at A Useful Guide to Combine Candlesticks with Indicators
How to formulate Heikin Ashi candlestick?
- HA Close: (High Low Open Close) / 4
- HA Open: (Prior HA Open Prior HA Close) / 2
- HA High is identified as the highest of three price levels seen as the prevailing high price, open price, and close price.
- HA Low is the lowest of three price levels seen as the prevailing low price, open price, and close price.
Continue Reading at The Complete Guide to Heikin Ashi EMA Strategy
Articles About Candlestick
