 Dedicated FREE FOREX VPS
 Free FOREX Virtual Private Server
 MT4 Demo Contest, Get $500
 Sign Up for an Account, Claim 60% Deposit Bonus
 Free MT4/MT5 VPS 2024
 Send E-mail and Get Free Merchandise
 $1K Refer a Friend Bonus for Pepperstone Pro clients
 Maximize Your Earnings with 100% Deposit bonus
 Trade to Win, $5,000 Monthly Demo Contest
 Claim 30% + 15% Deposit Bonus from LiteFinance
If you trade in a 15-minute chart, you probably need a responsive indicator to help you catch up with the fast movement of the price.
The 15-minute chart is widely used in forex trading for analyzing price movements and making trading decisions. Each candlestick or bar on the chart represents a 15-minute interval.
This chart is well-regarded as a short to mid-term time frame, striking a balance between capturing shorter-term price movements and reducing noise found in even shorter time frames. It is particularly suitable for day traders and scalpers.
The best indicator to use on a 15-minute chart for optimum profits is the combination of the Supertrend indicator, the 5 EMA, and the 20 EMA.
A Supertrend indicator is pretty similar to Moving Averages in the sense that it is plotted on price and can determine the current market price trends. Similarly, EMA is an Exponential Moving Average that measures trend direction over a period of time by placing more weight on current market data.
By combining all these trading conditions together, you will obtain one of the best trading strategies for scalping in a 15-minute chart.
The Supertrend Indicator for Trend Identification
The Supertrend indicator is a widely used tool in technical analysis for identifying trend direction and potential entry and exit points in various financial markets, including forex.
Based on the Average True Range (ATR) and trend-following principles, the Supertrend indicator plots a line above or below the price chart, indicating the prevailing trend direction.
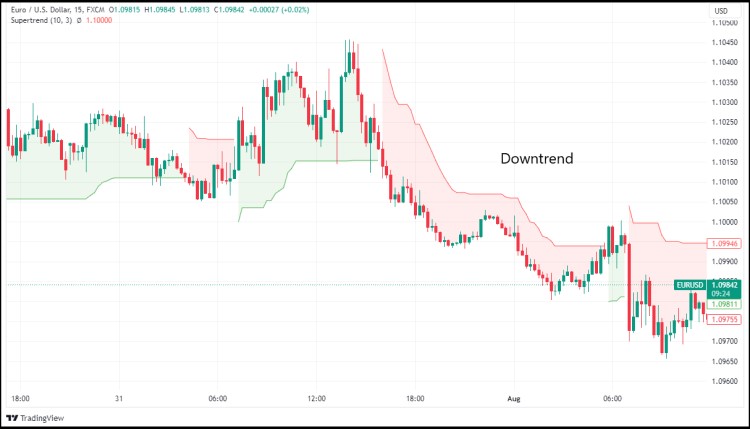
There are two main signals provided by the Supertrend indicator:
- Trend direction: When the Supertrend line is below the price, it signals a bullish trend, suggesting that the price is likely to move upward. Conversely, when the Supertrend line is above the price, it signals a bearish trend, indicating that the price is likely to move downward.
- Entry and exit signals: Traders often use the price crossing with the Supertrend line as a signal to enter or exit positions. For instance, a price crossing above the Supertrend line may indicate a buying opportunity, while a price crossing below the Supertrend line may indicate a selling opportunity.
Known for its simplicity and user-friendliness, the Supertrend indicator helps traders capture trends and stay on the right side of the market. However, it's essential to recognize that, like any technical indicator, it may produce false signals during choppy or sideways markets.
To enhance the accuracy of their trading decisions, traders often combine the Supertrend indicator with other tools and analysis techniques. That's why we try to combine it with the 5 EMA and 20 EMA.
5 EMA and 20 EMA for Trend Confirmation
The 5 EMA (Exponential Moving Average) and 20 EMA are widely used technical indicators in trading and technical analysis.
EMA is a moving average that gives more significance to recent price data, making it more responsive to current market conditions than simple moving averages (SMA).
The "5 EMA" represents the Exponential Moving Average calculated over the last five periods (e.g., five hours, five days, etc.), while the "20 EMA" represents the Exponential Moving Average calculated over the last twenty periods.
Traders commonly employ these EMAs to identify trends and potential entry and exit points in the market. When the 5 EMA crosses above the 20 EMA, it signals a bullish trend, suggesting a potential uptrend. Conversely, when the 5 EMA crosses below the 20 EMA, it indicates a bearish trend, suggesting a potential downtrend.
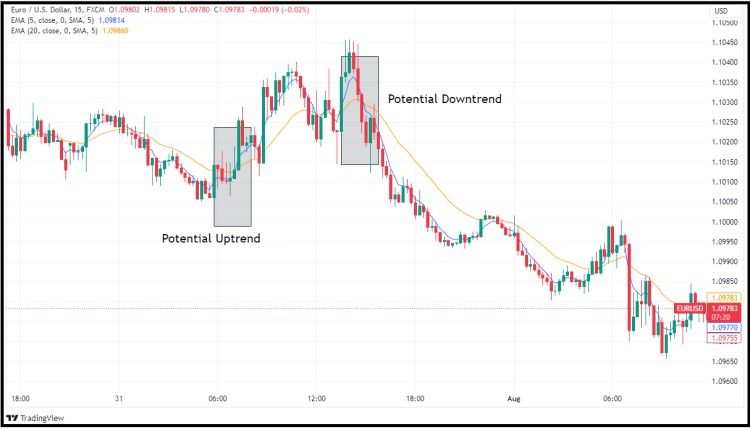
The combination of the 5 EMA and 20 EMA is frequently used as part of a trading strategy to confirm changes in trends, generate buy or sell signals, and manage risk.
Some traders complement the EMAs with additional indicators or oscillators to fine-tune their trading decisions, in this context, we'll gonna use the Supertrend indicator.
How to Combine Supertrend and EMA for 15-Minute Chart
Now that we've identified the best indicator setup for a 15-minute chart as the combination of the Supertrend indicator and EMA lines, let's understand how to put it to use as a trading strategy.
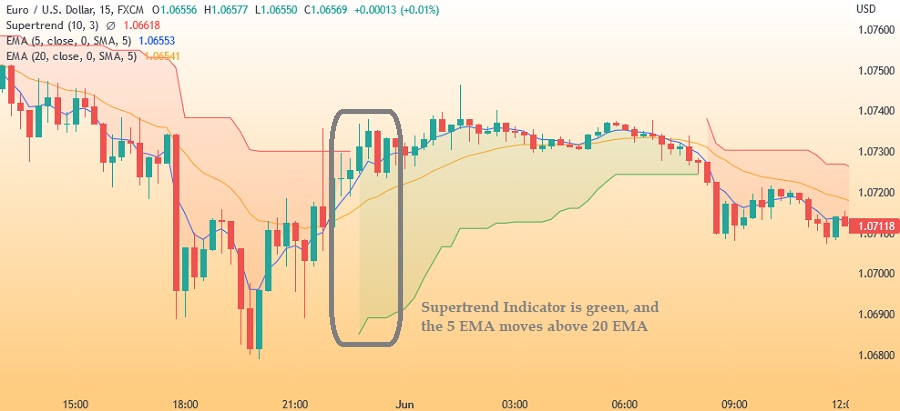
First, you should know that a Supertrend indicator changes color. It becomes green when the indicator is below the price and red when the indicator is above the price.
Keeping this in mind, we place BUY and SELL positions in the following cases:
Buy Rules
In order to place a BUY position, the Supertrend indicator has to turn green. This would mean that it is below the price. Next, the 5 EMA has to be above the 20 EMA in a crossover. When all these conditions are satisfied, you'll get a BUY signal.
See Also:
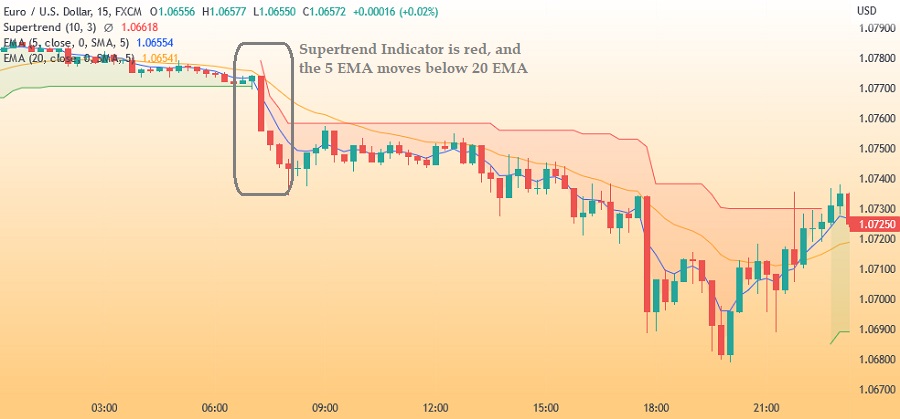
Sell Rules
Similarly, in order to place a SELL position, the Supertrend indicator has to turn red. This would mean that it is above the price. Next, the 20 EMA has to be above the 5 EMA in a crossover. When all these conditions are satisfied, you'll get a SELL signal.
Despite it all, you should know that just because it makes trading easier does not mean it makes it more profitable. Good trading management in risk and emotion plays an incredibly important role in your trading success too.


4 Comments
Mario
Jan 10 2024
Hey! Got a quick question about this EMA stuff. So, the article mentions that the "5 EMA" stands for the Exponential Moving Average calculated over the last five periods (like five hours or five days), and the "20 EMA" is the Exponential Moving Average calculated over the last twenty periods.
I'm curious about what exactly "period" means in EMA. Also, how do we crunch the numbers for EMA, and what's the deal with choosing 5 and 20 EMA specifically for a 15-minute chart, as the article suggests? Would love some insights on that! Thanks a bunch!
Paul
Jan 17 2024
Hey there! Great questions! In the world of EMA, "period" refers to the number of time intervals you're looking at, whether it's hours, days, or any other timeframe. Now, to calculate EMA, it involves giving more weight to recent data. It's a bit like giving the freshest info more importance.
As for why the article suggests using 5 and 20 EMA on a 15-minute chart - it's all about finding sweet spots. The 5 EMA reacts quickly to price changes, giving you a close eye on short-term movements. Meanwhile, the 20 EMA smoothens things out a bit, capturing more of the overall trend. Together, they offer a balance between quick reactions and a broader market picture, which can be handy when you're navigating a 15-minute chart. Hope that clears things up for you!
Salinas
Feb 26 2024
I'm a bit puzzled here. According to the article, it suggests that the most profitable combination of indicators for a 15-minute chart includes the Supertrend indicator, the 5 EMA, and the 20 EMA. However, what's confusing is the emphasis solely on the 15-minute chart. Another article on this site suggests combining different time frames for confirmation. So, the question arises: Is it better to stick with just one chart or utilize multiple time frames?
Vincent
Feb 28 2024
So, here's the deal: the article suggests that for making bank on a 15-minute chart, you should roll with a combo of indicators like the Supertrend, 5 EMA, and 20 EMA. But here's where it gets tricky: while this article hammers home the 15-minute chart, another one on the site talks about mixing it up with different time frames for confirmation. So, the big question is: stick with one chart or mix it up with multiple time frames? Honestly, it boils down to what floats your boat and what works best for your trading groove. Some folks swear by sticking to one frame, while others dig the extra insight from checking out different time frames. Just gotta figure out what clicks best for you and roll with it!