Dedicated FREE FOREX VPS
 Free FOREX Virtual Private Server
 MT4 Demo Contest, Get $500
 Sign Up for an Account, Claim 60% Deposit Bonus
 Free MT4/MT5 VPS 2024
 Send E-mail and Get Free Merchandise
 $1K Refer a Friend Bonus for Pepperstone Pro clients
 Maximize Your Earnings with 100% Deposit bonus
 Trade to Win, $5,000 Monthly Demo Contest
 Claim 30% + 15% Deposit Bonus from LiteFinance
Using 3 EMA lines will allow you to see a strong signal of the trend and tell you that the trend will last. Here is an example.

To successfully ride the trend, you must be able to determine a strong trend and enter the trade as soon as you discover the trend. Most people can successfully complete the first point. However, they struggle to follow through with the second point.
This is due to the lag of technical indicators, where they will illustrate the trend as well established instead of a beginning. So, in order to avoid missing the opportunity to trade using a trend, you must simply enter the trend after you have discovered a strong signal that the trend will continue, one of which is by spotting crossover signals from three EMA lines.
Using three EMA lines will allow you to see a strong signal of the trend and tell you that the trend will last. The most popular EMA lines that traders use are a crossover of 5 EMA, 20 EMA, and 50 EMA.
It is better to use a longer time frame to trade using this strategy, such as 4H or a daily chart. The crossover will show a major trend that could last days if not weeks.
Using Three EMA Crossover Lines to Identify Strong Trends
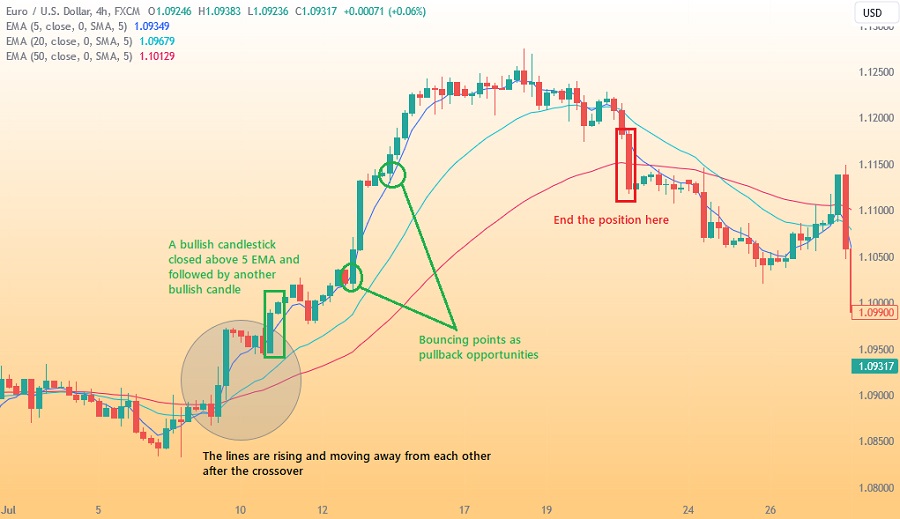
Here is an example of identifying an uptrend with three EMA crossover lines. The ideal condition is when the 5 EMA line crosses over the 20 EMA and the 20 EMA line crosses the 50 EMA, all from below.

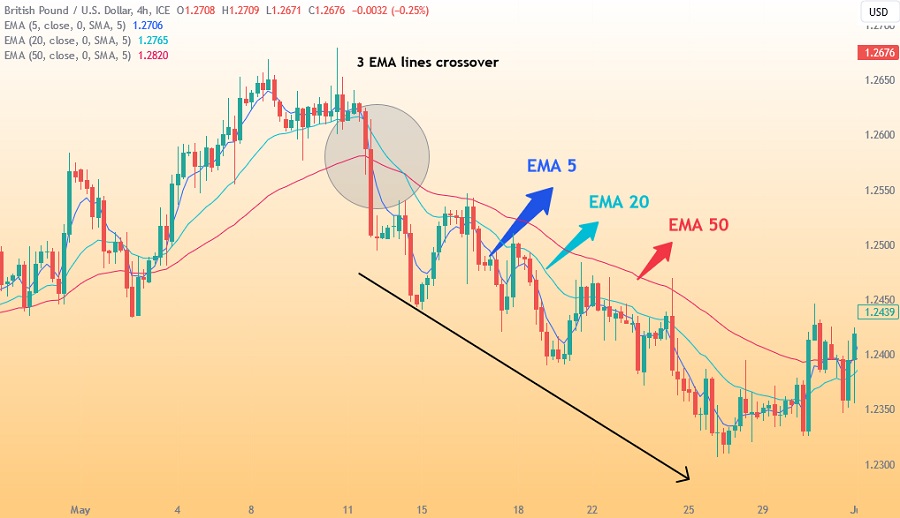
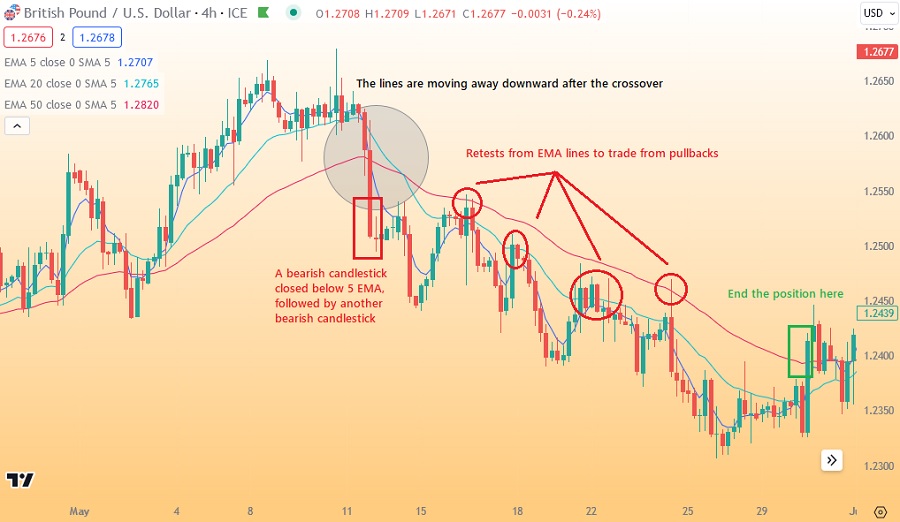
On the other hand, here's an example of three EMA crossover lines that indicate a strong downtrend:
Entry and Exit Rules
During a strong uptrend, make sure that you only open a buy position on these conditions:
- The 3 EMA lines are moving up away from each other after making a bullish crossover.
- There's a bullish candlestick closed above the 5 EMA, followed by another bullish candlestick after.
- If the trend has been formed for some time, wait until the price makes a small retracement and bounces from the EMA lines. This is a strategy to capitalize on a pullback opportunity.
- To close the position, wait until there's a bearish candlestick closed below the 50 EMA.
Meanwhile, you could open a sell position with the following conditions:
- The 3 EMA lines are declining and moving away from each other after making a bearish crossover.
- There's a bearish candlestick closed below the 5 EMA, followed by another bearish candlestick after.
- If the trend has been formed for some time, wait until the price makes a small retracement and retests the EMA lines.
- Close the position if there was a bullish candlestick closed above the 50 EMA.
Pros and Cons of Using Three EMA Crossover Lines
Using three Exponential Moving Average (EMA) crossover lines in trading has its advantages and disadvantages. Let's explore the pros and cons:
| ✔️Pros | ❌Cons |
|
|
In conclusion, the 3 EMA crossover strategy can be a valuable tool for trend identification and generating trading signals. However, like any trading approach, it has its limitations and requires careful consideration and risk management to be effectively applied. Traders should complement this strategy with other technical indicators and fundamental analysis for more robust decision-making.
See you!
Rico FY