Dedicated FREE FOREX VPS
 Free FOREX Virtual Private Server
 MT4 Demo Contest, Get $500
 Sign Up for an Account, Claim 60% Deposit Bonus
 Free MT4/MT5 VPS 2024
 Send E-mail and Get Free Merchandise
 $1K Refer a Friend Bonus for Pepperstone Pro clients
 Maximize Your Earnings with 100% Deposit bonus
 Trade to Win, $5,000 Monthly Demo Contest
 Claim 30% + 15% Deposit Bonus from LiteFinance
The TEMA crossover strategy is actually pretty simple. What makes it special is the main indicator used that reflects a much faster response than the common EMA.
TEMA is an acronym that stands for Triple Exponential Moving Average, and it is a technique that may be utilized to determine patterns in the forex markets. Patrick Mulloy was the one who invented it, and the first time it was published was in 1994.
Mulloy came to the realization that he might lessen the amount of time that elapsed between the indication and the price movement by creating a unique compound that consisted of a Basic Exponential Moving Average, a Double Exponential Moving Average, and a Triple Exponential Moving Average. Because it is a specialized indicator, the TEMA is not typically available on standard trading platforms.

The Purpose of TEMA Indicator
Standard EMAs have more of a lag than the Triple Exponential Moving Average, which makes the traditional EMA less sensitive. That's why Patrick Mulloy took the concept one step further and developed the Triple Exponential Moving Average not long after he developed the Double Exponential Moving Average in 1994. As a result, the Triple Exponential Moving Average is better suited for short-term trading.
In the same way that its ancestor, DEMA does, the TEMA adjusts a standard EMA by taking into account the lag difference between several EMAs. On the other hand, TEMA's formula makes use of a Double EMA in addition to the single EMAs that are utilized in DEMA. The result of applying this adjustment yields a Moving Average that maintains a distance from the price bars that is even less than that of DEMA.
How to Use TEMA for Trading
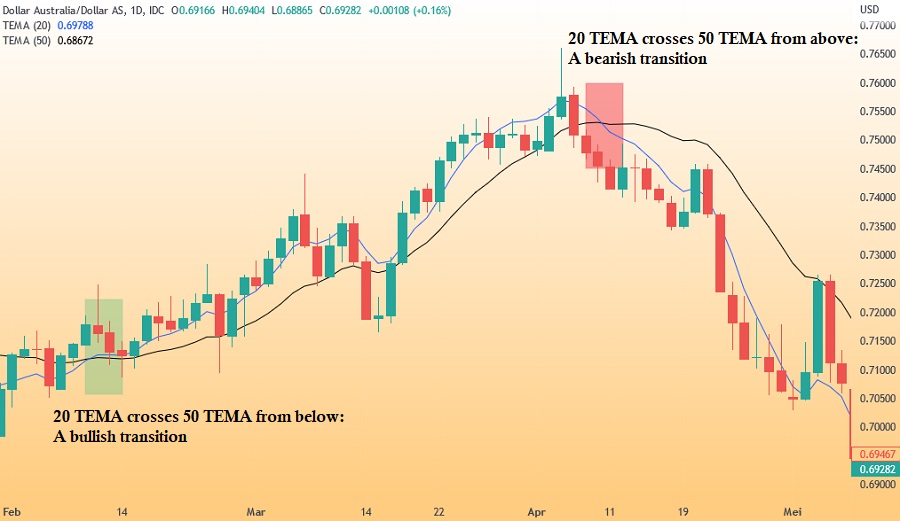
When following the TEMA crossover strategy, we have to look at both the short-term TEMA and the long-term one. This can be seen when the 20-day TEMA crosses above the 50-day TEMA.
In general, the TEMA crossover strategy works in two ways:
- If the short-term TEMA line crosses above the long-term TEMA line, we would get the signal that the market is bullish and we can open a buy position.
- If the long-term TEMA line crosses below the short-term TEMA line, we get the signal that the market is bearish and we can open a sell position.
A bullish position can be closed when a bearish signal opens and vice versa.
Beware the Drawbacks
Despite the fact that the TEMA lessens lag, it is nevertheless affected by some of the age-old problems that surround other MAs. During periods in which the price is moving in both directions, the MA or TEMA may not give much useful information and may produce misleading warnings.
Additionally, because it responds more quickly to shifts in price, the TEMA will follow the price in a manner that is more accurate than that of a Simple Moving Average. This can be a problem for traders who want to enjoy it when their indications are behind since they don't want their indicators to respond to each and every movement in price. As a general rule, this type of trader does not want to be forced out of their positions until there is a big shift in trend.