Dedicated FREE FOREX VPS
 Free FOREX Virtual Private Server
 MT4 Demo Contest, Get $500
 Sign Up for an Account, Claim 60% Deposit Bonus
 Free MT4/MT5 VPS 2024
 Send E-mail and Get Free Merchandise
 $1K Refer a Friend Bonus for Pepperstone Pro clients
 Maximize Your Earnings with 100% Deposit bonus
 Trade to Win, $5,000 Monthly Demo Contest
 Claim 30% + 15% Deposit Bonus from LiteFinance
Hey, there's a reason why candlestick chart is the most popular indicator of price movement. It's because it tells you how the bulls (the buyers) and the bears (the sellers) tried to enter the battlefield and guess, who survived it?
There's a reason why the candlestick chart is the most popular indicator of price movement. It's because candlestick patterns you how the bulls (the buyers) and the bears (the sellers) tried to enter the battlefield.
As a matter of fact, the strength of bulls and bears can be hinted at by the size of candle bodies and the length of candle shadows. Big-sized bullish candles with short to no shadows on each side typically reflect a very bullish market and vice versa.
Based on the principles above, there are many standards on how to read the market by identifying the candle's size, the shadows' length, and the position of the shadows.
To make it easier to understand, let's simply categorize the candlestick into some patterns and learn how they describe the market condition.
Single Candlestick Patterns to Read the Market
There are already several top patterns traders will usually look at to tell where market forces will likely end up. The most basic pattern are spinning tops, marubozu, and doji, and that's just the start.
Here we will discuss popular single bar patterns among candlestick patterns and how they tell you a picture of a battlefield between the bulls and the bears.
Single candlestick patterns mean that there is only one candlestick bar that you need to look for to tell how the ongoing battle between the buyers and the sellers would end up. Here's the list:
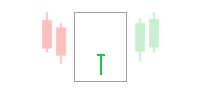
1. Hammer and Hanging Man
These two patterns are twins, except they show two different battle results depending on past price movement. Both are identified by a small body, long lower shadow, and short to no upper shadow.

Hammer candlestick pattern is called the hammer because it looks like one. The pattern is pretty much when all the bears wield hammers to nail down the price even further which is indicated by the long lower shadow. However, the bulls come up fresh while their enemies are exhausted, closing the price near the opening. Hammer is a bullish reversal pattern, so every buyer should be prepared to enter the market when this pattern is formed during a downtrend.
While looking the same, the hanging man tells a completely different result. The bears called out reinforcements, outnumbering the bulls (indicated by longer lower shadows), and that looked way too intimidating to the bulls so they gave up not long after, closing the price near the open. Cheers to the bears, as the hanging man is a bearish reversal marker and so it's a good indicator for sellers to ride the upcoming downtrend.
2. Inverted Hammer and Shooting Star
Both look identical, got little bodies, similar long upper shadows, and small to no lower shadows.

Longer upper shadows of an inverted hammer tell us that the bulls were rallying hard without mercy after a downtrend. Clearly, to book revenge, leaving the bears to bite the dust so they can only close the price near the open. This condition provides a good situation for buyers to enter the market.
Different story from the inverted hammers, shooting stars show how the bulls got way too greedy but end up beaten by the bears. After shooting all their armaments blindly because they thought it had been a long uptrend victory, the bulls scored no particular body counts, and the bears took chances by retaliating, closing the price just close to the low of the day. As such, sellers could take advantage of this condition by shorting their trades.
Important Tips on Reading Candlestick Patterns
Simple as it is, it's very tempting to open a position when one of the candlestick patterns takes form. However, the market is still a volatile price distribution, and you have to use other indicators or patterns to confirm where the upcoming price will likely end up. It also must be noted that a single candlestick pattern is just the beginning of understanding chart patterns.
In general, successfully reading the market with candlestick patterns involves:
- Learning and identifying various candlestick patterns.
- Understanding their meanings and implications.
- Confirming them with other technical indicators.
- Using the appropriate time frame.
- Considering the broader market context.
- Practicing good risk management.
Memorizing hundreds of candlestick patterns can be a daunting task for any trader. Is there a more effective approach to comprehending price action? Discover the answer in How to Master Price Action Trading with Candlesticks.