Dedicated FREE FOREX VPS
 Free FOREX Virtual Private Server
 MT4 Demo Contest, Get $500
 Sign Up for an Account, Claim 60% Deposit Bonus
 Free MT4/MT5 VPS 2024
 Send E-mail and Get Free Merchandise
 $1K Refer a Friend Bonus for Pepperstone Pro clients
 Maximize Your Earnings with 100% Deposit bonus
 Trade to Win, $5,000 Monthly Demo Contest
 Claim 30% + 15% Deposit Bonus from LiteFinance
From RSI to Ichimoku, here is a list of the most popular MT4 indicators traders can try to maximize trading activity. What signal do they represent?
During trading, it's normal for traders to use certain tools or techniques to help them predict price movements. Technical indicators are among the most popular tools that traders often use. This is because technical indicators can help traders make better trading decisions, especially when dealing with complex market situations.
In this regard, the MetaTrader 4 (MT4) trading platform is one of the best examples. Especially because traders around the world widely use this platform. MT4 provides a wide range of technical indicators that are beneficial for traders. However, among many available indicators, only a handful becomes the trader's favorite. Anything? Check out the full review below.
1. Relative Strength Index (RSI)
The RSI indicator was first published by J. Welles Wilder in 1978. RSI is one of the most popular indicators used in technical analysis. The RSI indicator can show whether the market is overbought or oversold to assist traders in making the right trading decisions.
The RSI indicator has the following basic formula:
RSI = 100 - (100 / (1 + RS))
The result of this calculation is automatically displayed on the forex chart as a signal line.
How to Enter RSI in MT4
RSI is a built-in indicator that is available on the MT4 platform. To install this indicator into the MT4 chart, traders can follow the following steps.
- Click Insert
- Select Indicators
- Select Oscillators
- Select Relative Strength Index.
The period is automatically set to 14, but you can change it to according to your needs.
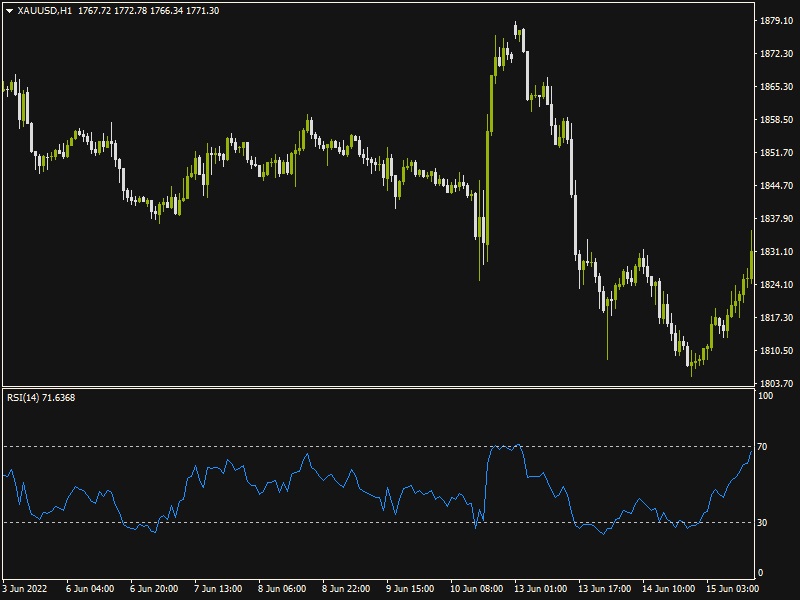
How to Use the RSI Indicator
So, how do you use the Relative Strength Index indicator? The RSI indicator can be used in several ways. These are the three most common ways of using the RSI indicator, including:
- Identify Overbought or Oversold Conditions
When the RSI rises above level 70, it indicates that the market is in overbought condition. On the contrary, when the RSI chart falls below level 30, the market is in oversold condition. An overbought condition can be a signal to Sell; Meanwhile, Oversold could be a signal to Buy. - Entry Signal from RSI Divergence
Divergences occur when the price and the RSI line move in opposite directions. A bullish divergence occurs when the price makes lower lows while the RSI line makes higher lows. This indicates that downward price momentum is waning and could signal price strengthening to come. Conversely, a bearish divergence occurs when the price makes a higher high while the RSI line forms a lower high. This indicates that the upward momentum in the price is waning and could be a sign of weakness. - RSI As Confirmator
RSI can confirm other trading signals, such as candlestick patterns, trend indicators, or support and resistance levels. For example, suppose you see a candlestick pattern indicating a price reversal. In that case, you can use the RSI to confirm this signal by looking for divergences or seeing if the RSI is indicating an Overbought or Oversold condition.
2. Fibonacci Retracement/Extension Tool
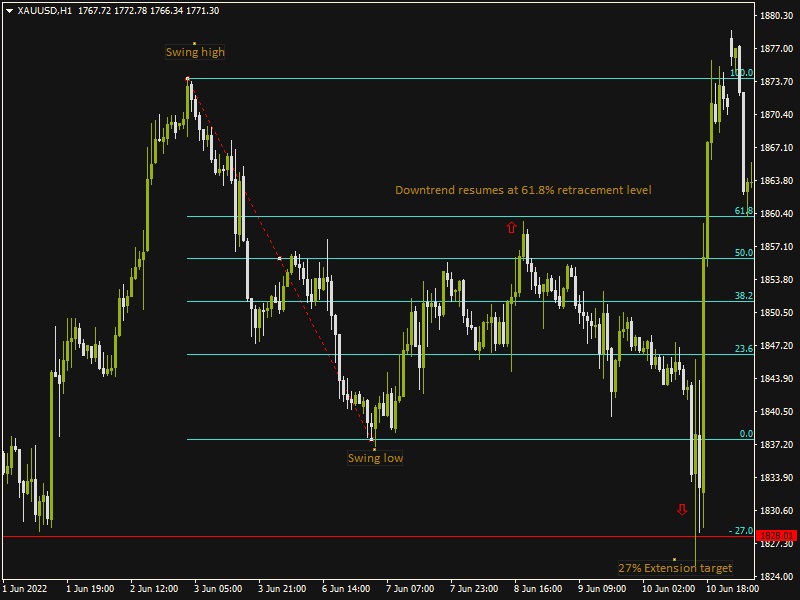
Retracements or pullbacks in a trend have become the nature of the market and will continue to be repeated. Therefore, every trader needs tools to determine where the retracement will end and where the trend will continue. This is why the Fibonacci Retracement and Fibonacci Extension tools are in great demand by many traders.
You will see neither on the MT4 trading platform in the indicator ion. Fibonacci is a tool and will be found under the "Tools" tab.
The Fibonacci Retracement Indicator is a trading tool based on a special number ratio sequence. This figure was determined by an Italian mathematician who gave the name to this trading tool. Each Fibonacci sequence is a sequence of fourteen integers, where the next number is generated by adding the previous and current numbers. So, in the sequence of numbers 0.1,1,2,3,5,8,13,34,55,89,144, and 233, you will see that the next number is the current number plus the last number.
When you divide the last number by the current number, you will get a value that is close to what is known as the Golden Ratio. These ratios are 0.236, 0.382. 0.5, 0.618, 0.786, 0.886, 1.0, 1.272, 1.414, 1.618, etc. Ratios above 1.0 are extension levels, while below 1.0 are retracement ratios.
The good news is that the Fibonacci Retracement tool will automatically determine these ratios on the MT4 chart. Fibonacci Retracement has a dotted trend line that determines price movements (i.e., from high to low in a Downtrend or from the latest lower to the latest high in an Uptrend).
How to Enter Fibonacci Retracement/Extension to MT4
You can access the tool and add it to your MT4 chart by clicking Insert -> Fibonacci -> Retracement menu. Click on the "Use last X bars" option while customizing the tool settings to enable this function.
Once Fibonacci Retracement levels have been determined, they can serve as areas of support or resistance.
How to Use Fibonacci Retracements/Extensions
Fibonacci Retracements are used to identify potential support and resistance levels. On the other hand, Fibonacci Extensions are used as a tool to identify potential price target levels. For details, here are the steps for using Fibonacci Retracement and Fibonacci Extension:
Fibonacci Retracements:
- Identify market trends. The first step is to identify the current market trend. If the market is in an uptrend, then Fibonacci Retracements can be used to identify support levels. Meanwhile, the Fibonacci Retracement is used to identify resistance levels if the market is in a downtrend.
- Identify starting and ending points. The starting point is usually chosen at the high or low point of the current market trend, while the ending point is chosen at the latest price movement.
- Define Retracement levels. Fibonacci Retracement uses Retracement levels from 0% to 100%, which shows how far price movements can retreat from market trends. The most common retracement levels are 38.2%, 50%, and 61.8%, calculated based on Fibonacci ratios. Traders can add other levels as desired.
- Identify potential support and resistance levels. After determining Retracement levels, traders can identify potential support and resistance levels. These levels indicate where the price might reverse or be corrected before continuing the current trend.
Fibonacci Extensions:
- Identify starting and ending points. Like Fibonacci Retracement, Fibonacci Extension also analyzes the starting and ending points of the price movement. The starting point is usually chosen at the highest or lowest point of the current trend, while the ending point is chosen at the latest price movement.
- Set the Extension level. Fibonacci Extension uses Extension levels that are placed above or below the endpoint. Common Extension levels are 61.8%, 100%, 161.8%, 261.8%, and 423.6%, calculated based on Fibonacci ratios.
- Identify potential price target levels. These levels indicate where the price may reach a certain level before continuing the current trend.
3. Ichimoku Kinko Hyo
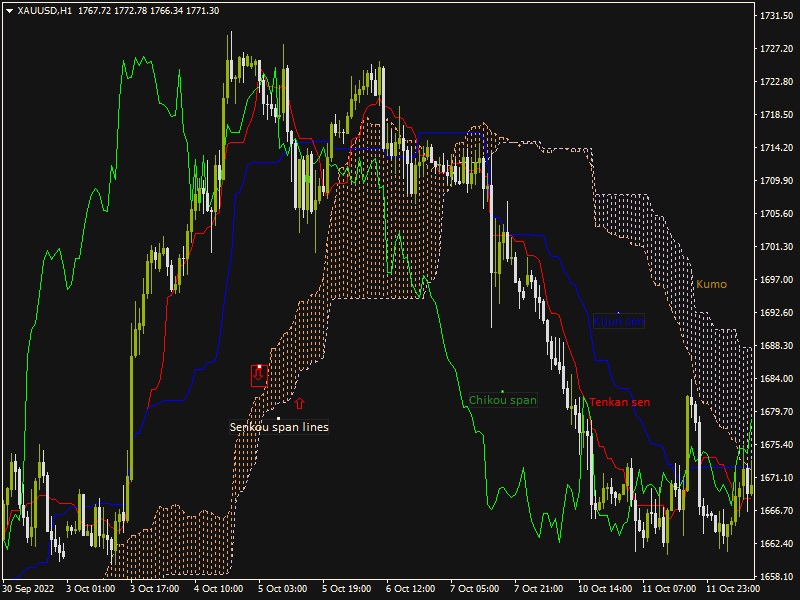
Ichimoku Kinko Hyo is the next popular MT4 indicator often used by traders. Although many traders are reluctant to use it because it is too complex, this indicator can be reliable and useful for its users.
The main reason traders find this indicator too complex is that it consists of several components. However, this is what makes it a very flexible indicator. Traders may use each component differently, depending on the market situation and individual trading preferences.
Broadly speaking, Ichimoku Kinko Hyo consists of six main components, including:
- Kumo (Japanese name for "cloud")
- Tenkan sen (line)
- Kijun sen (line)
- Senkou span A-line
- Senkou span B-line
- Chikou Span
Kumo is an important component of Ichimoku Kinko Hyo as it can provide important information about trends and potential support and resistance levels. In an Uptrend condition, Kumo is called Up Kumo; whereas in Downtrend conditions, Kumo is known as Down Kumo.
How to Add Ichimoku Kinko Hyo to MT4
The Ichimoku Kinko Hyo indicator is a trend indicator on the MT4 trading platform. To insert the Ichimoku indicator into the MT4 price chart, you can follow these steps:
- Click Insert
- Select Indicators
- Select Trends
- Choose Ichimoku Kinko Hyo.
How to use Ichimoku Kinko Hyo
When used to identify support resistance, the Senkou Span line supports when the price exceeds the Kumo. Meanwhile, when below the Kumo, the line functions as a sequential resistance level. Usually, when the price is inside the Kumo, the market consolidates into a range. A Kumo breakout to the north (up) or south (down) indicates a new trend and is often used as a reference in determining market entry and exit points.
The Senkou span line serves as a support and resistance tool, which depends on the position of the price in relation to the Kumo.
The Tenkan Sen and Kijun Sen lines (where "sen" stands for line) carry out reversal and breakout trading. Trend reversal trading is indicated by crossing the Tenkan line above or below the Kijun line (TK cross), prompting traders to open Buy or Sell positions toward the TK cross.
The Chikou Span line is used as a trading filter, not as a signal to buy or sell. Whether the price is trending up or down or sideways is determined by the price's location in relation to the Chikou span. The price is considered bullish when the price is above the Chikou span, while the price is considered bearish when the price is below the Chikou span.
The most interesting thing about indicators is that traders do not have to use them separately. Some indicators can give better results when combined. The question is, how to combine indicators for better trading results?